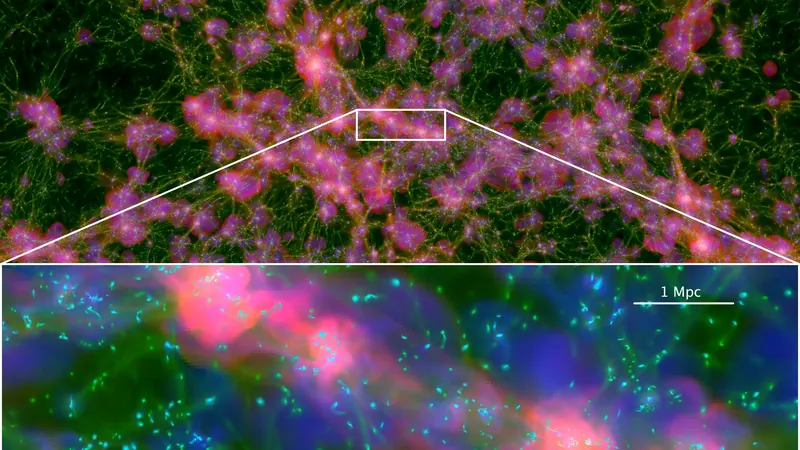
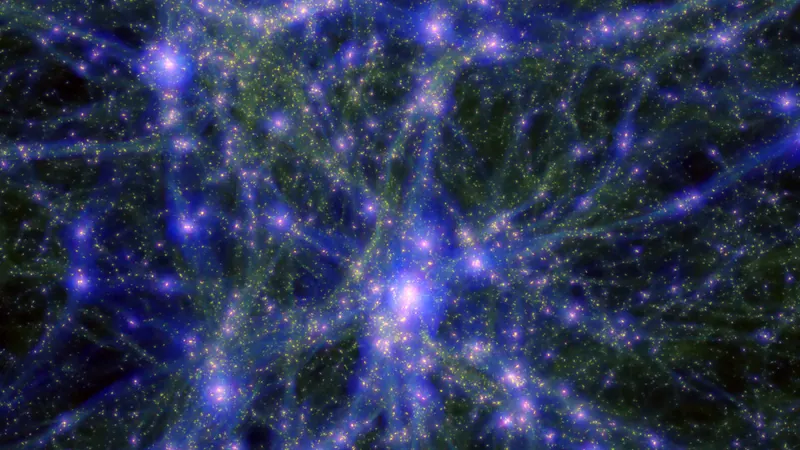
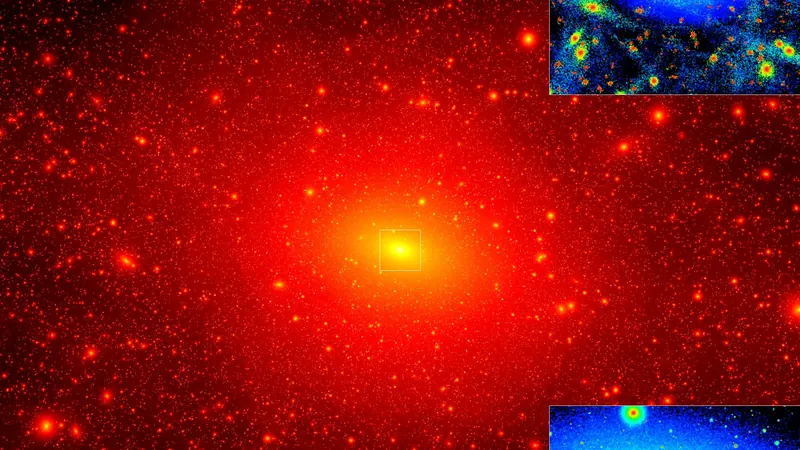
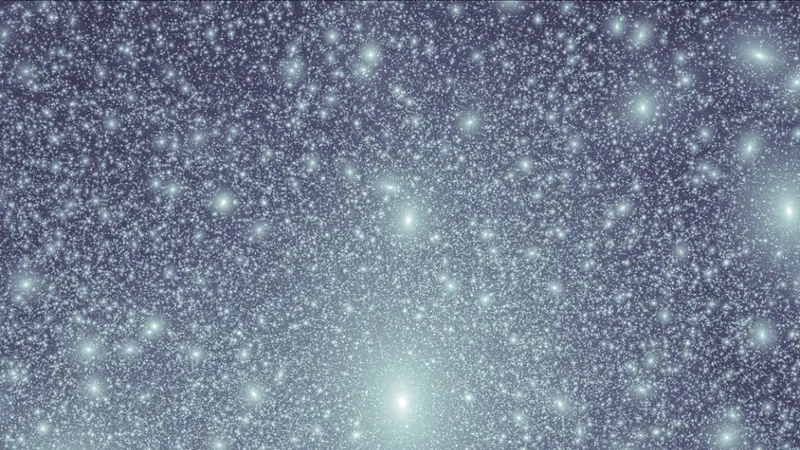
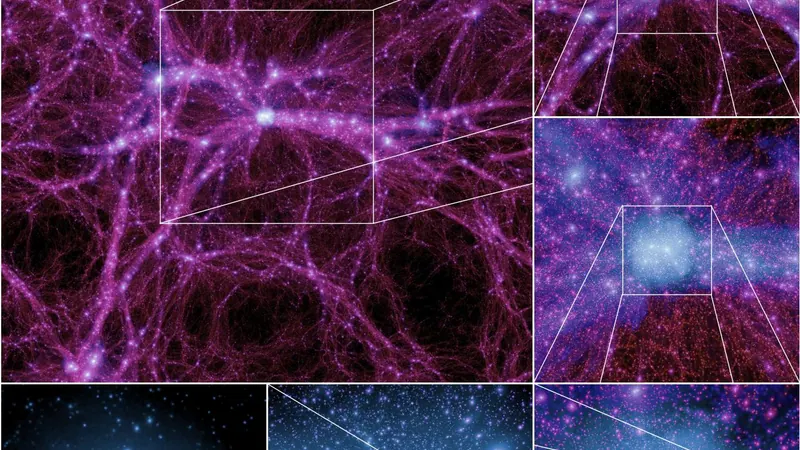
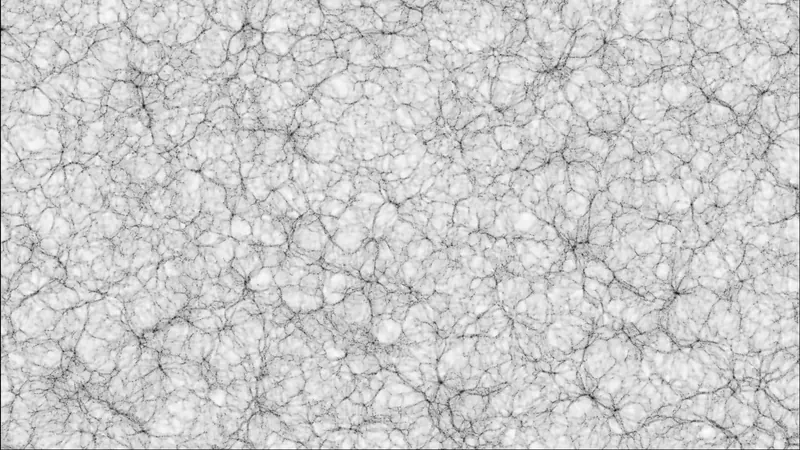
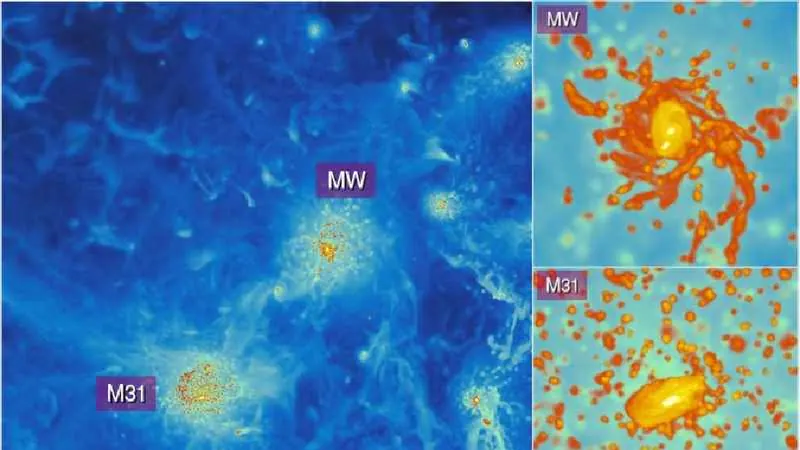
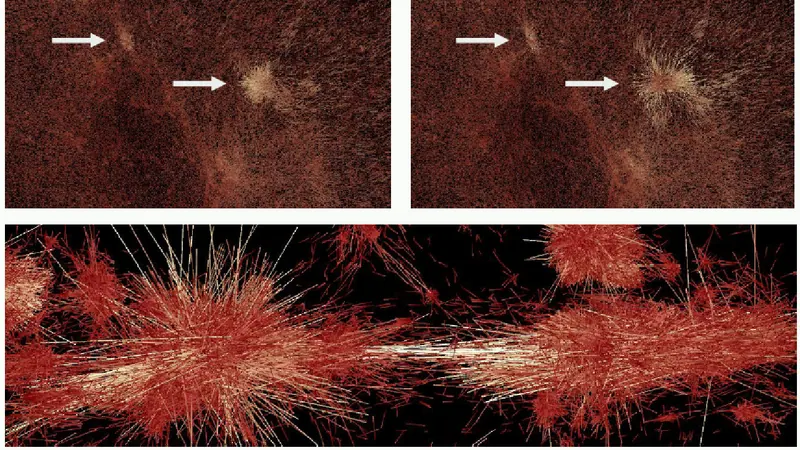
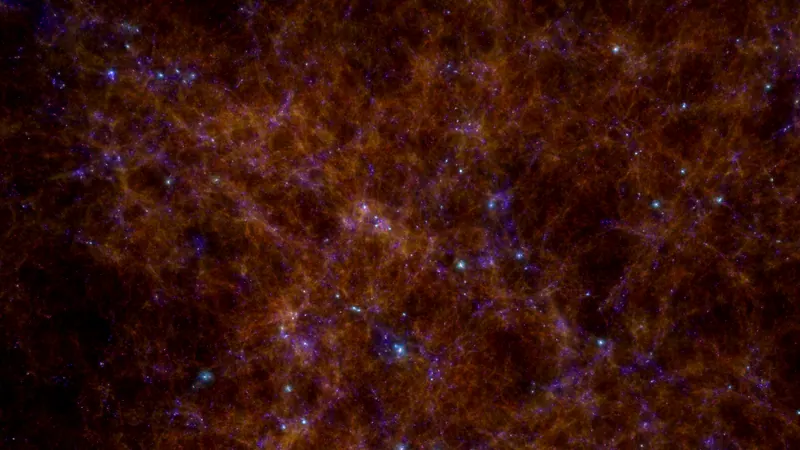
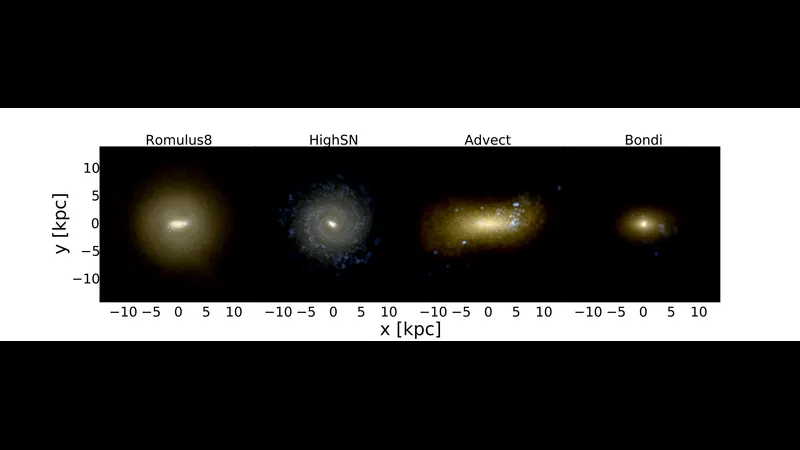
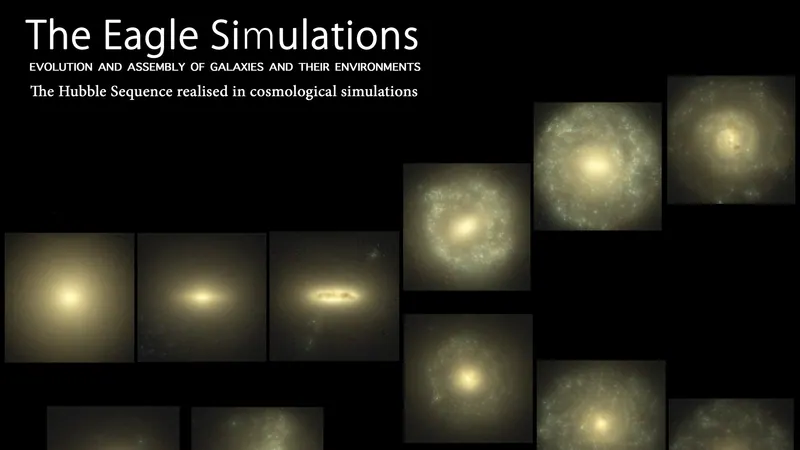
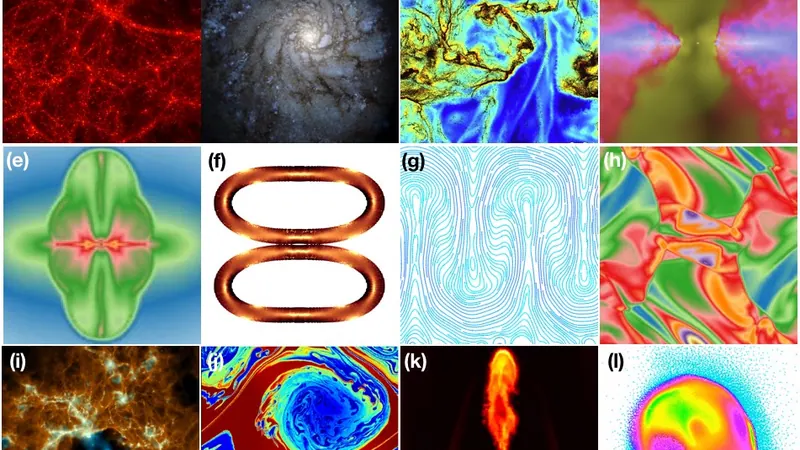
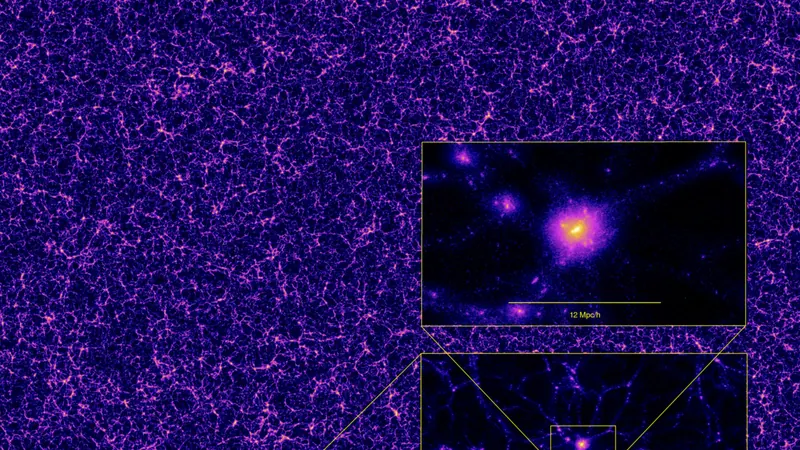
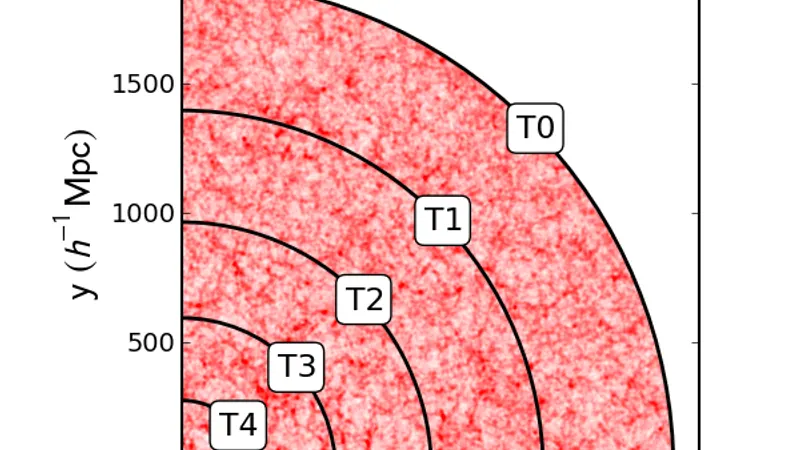
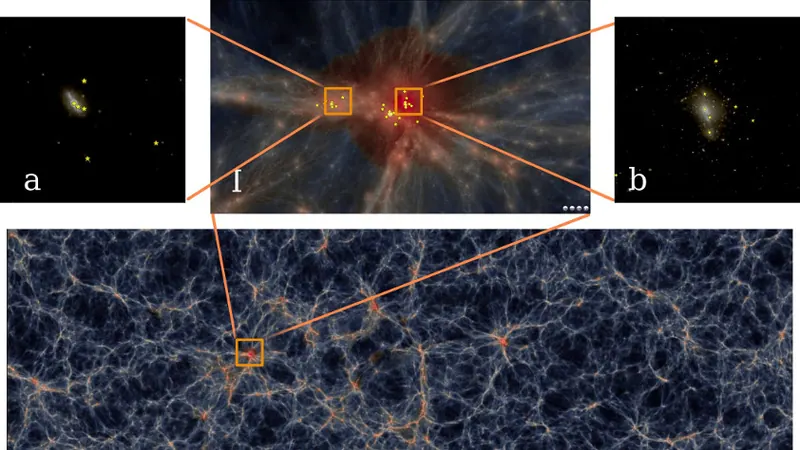
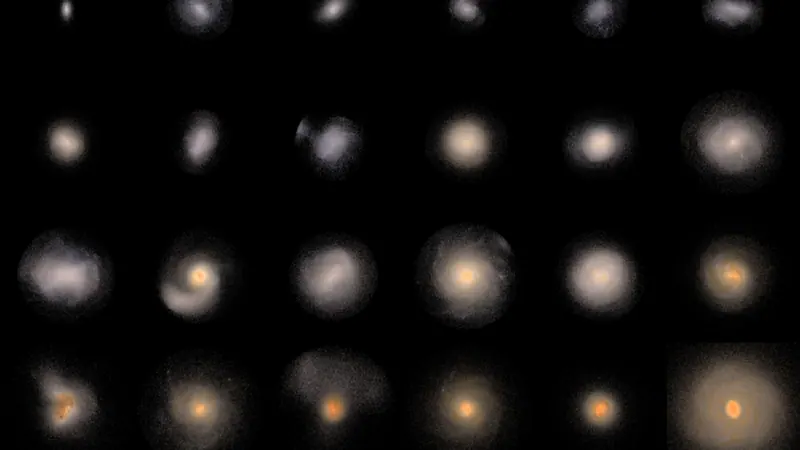
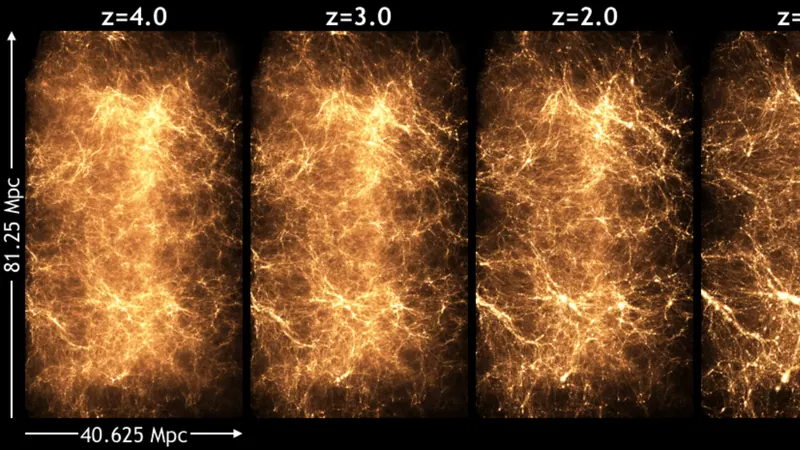
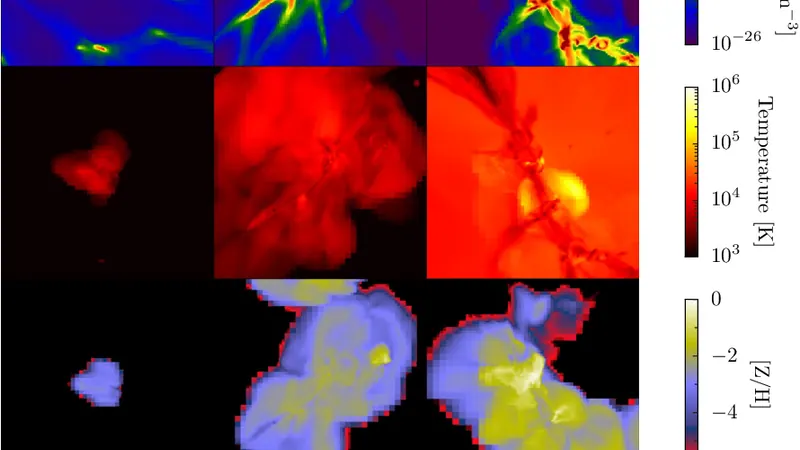
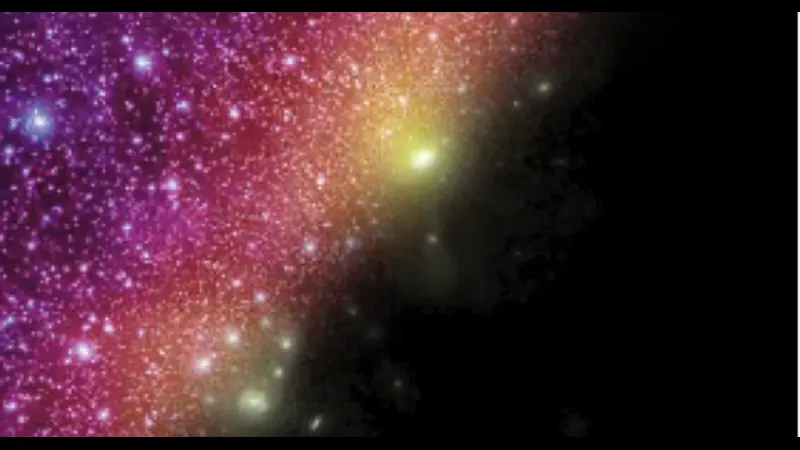
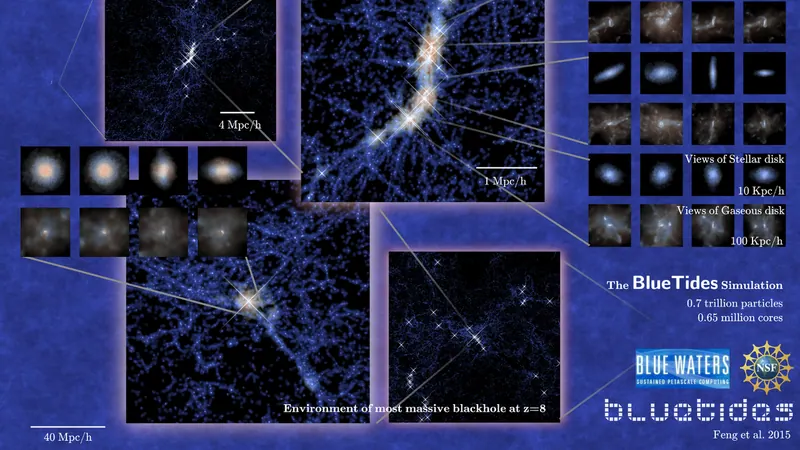
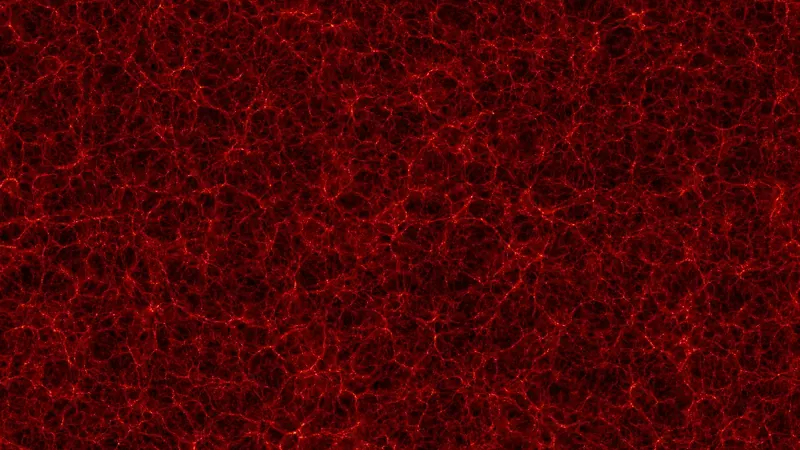
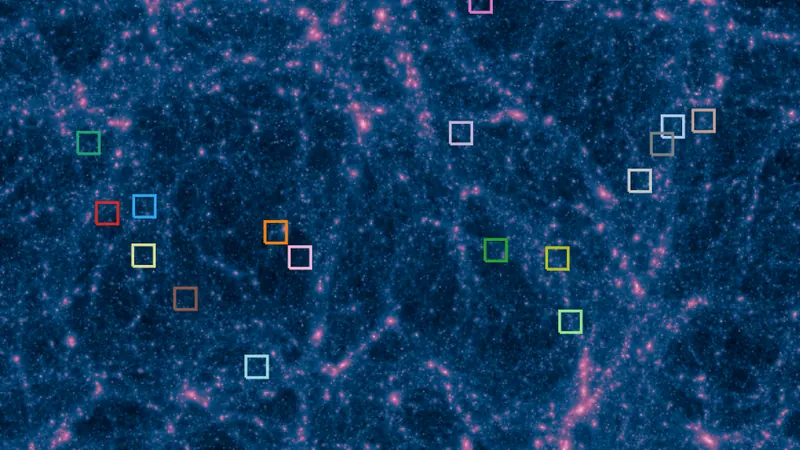
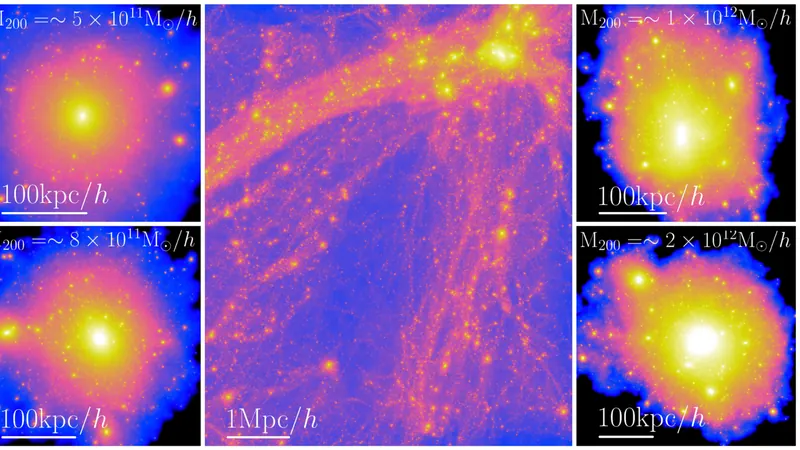
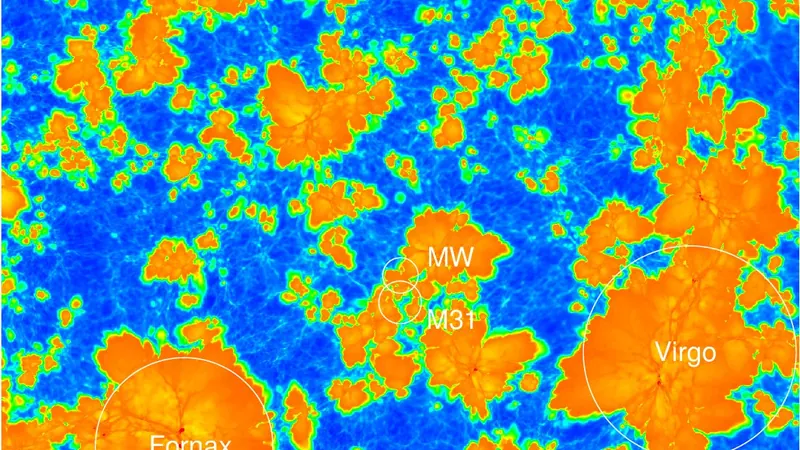
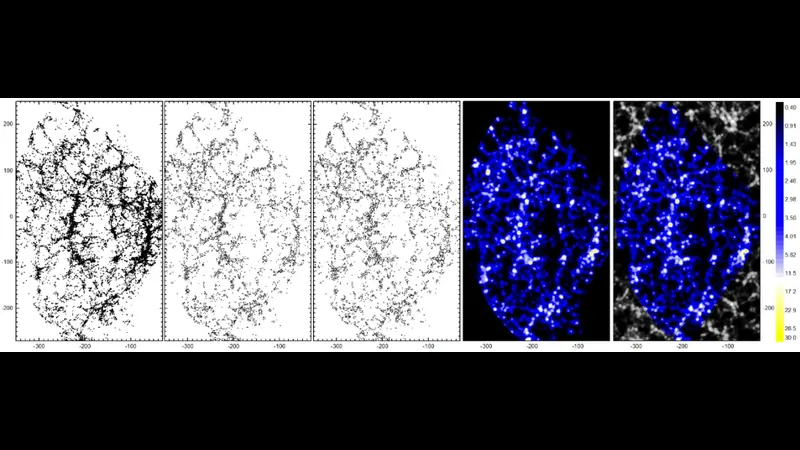
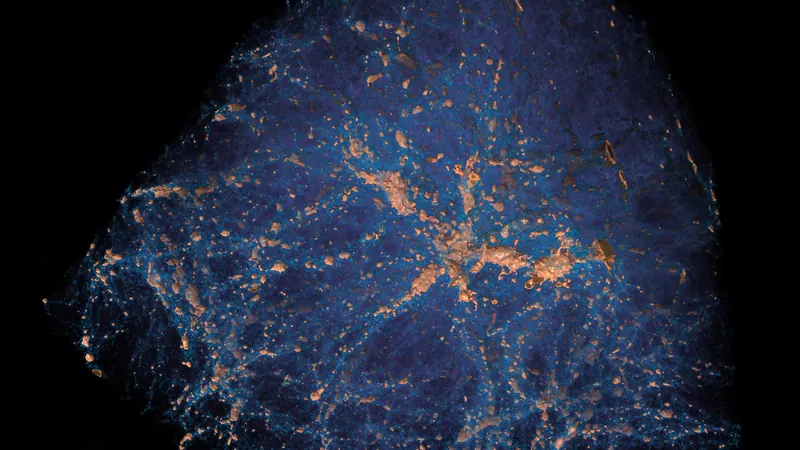
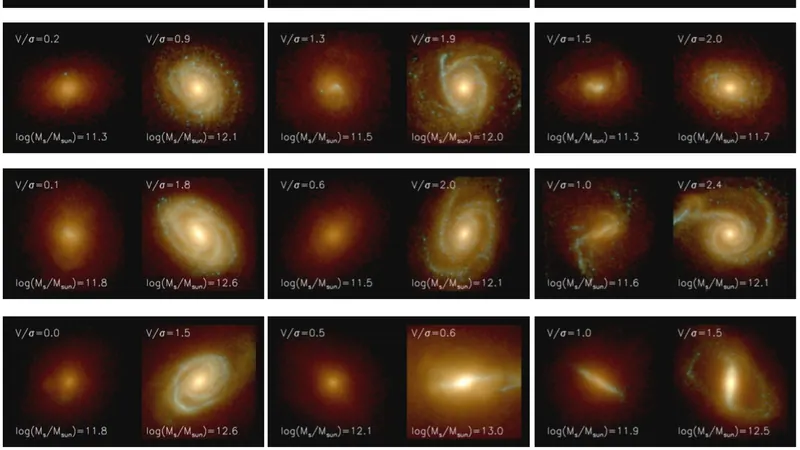
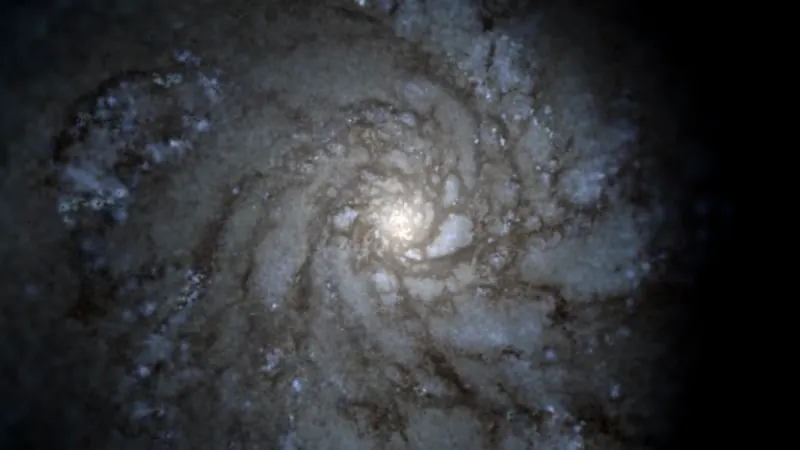
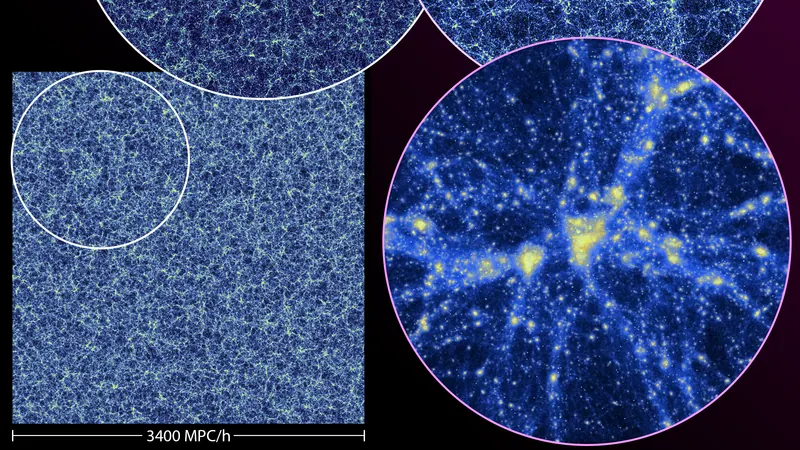
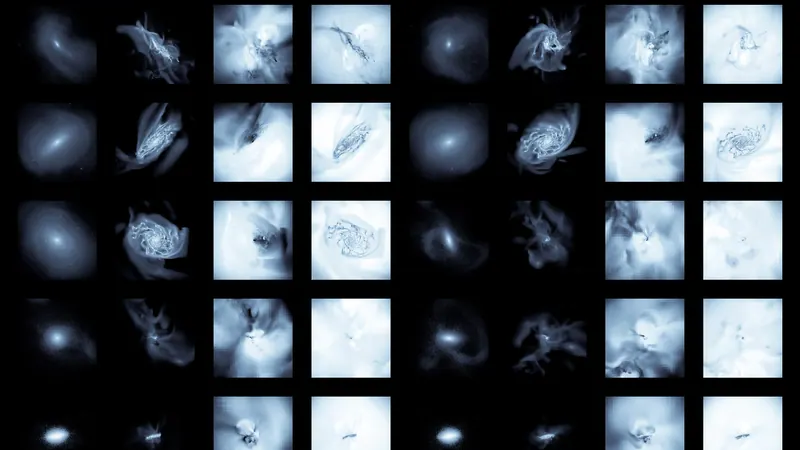
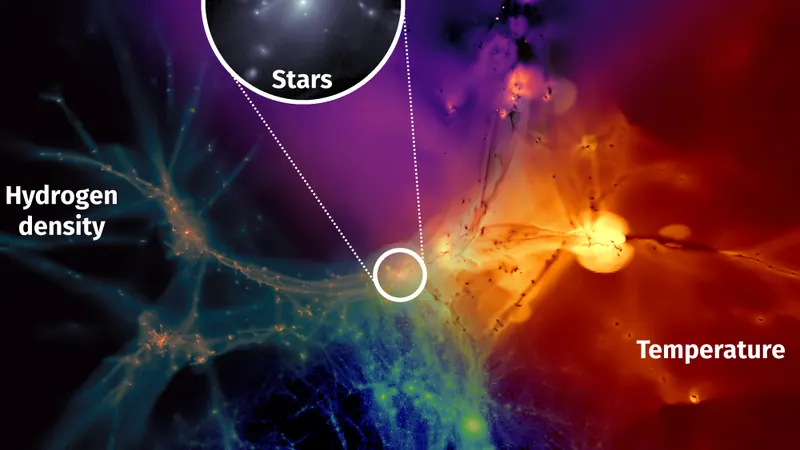
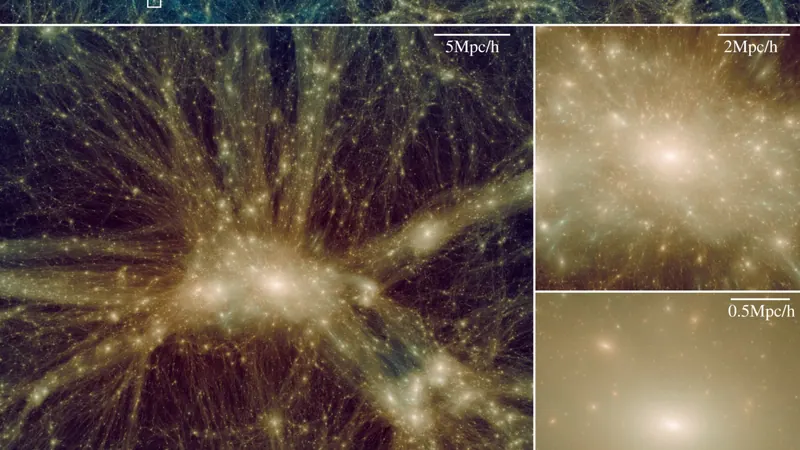
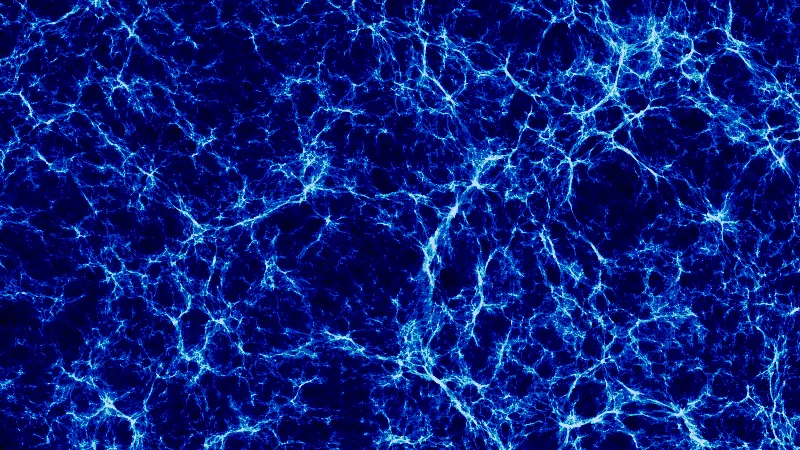
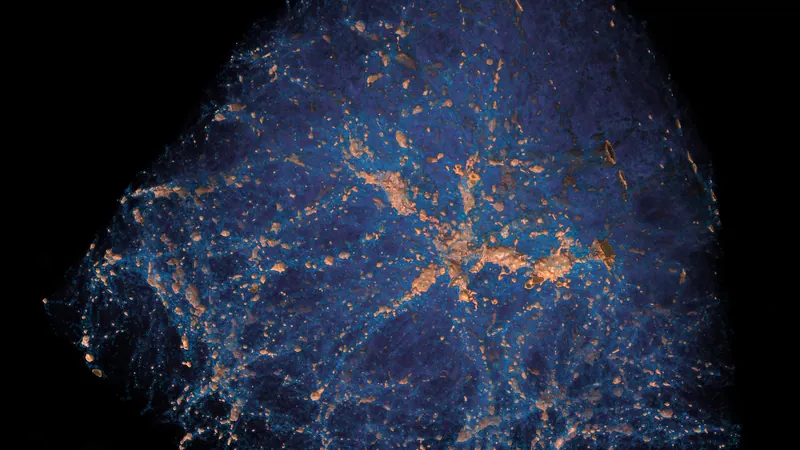
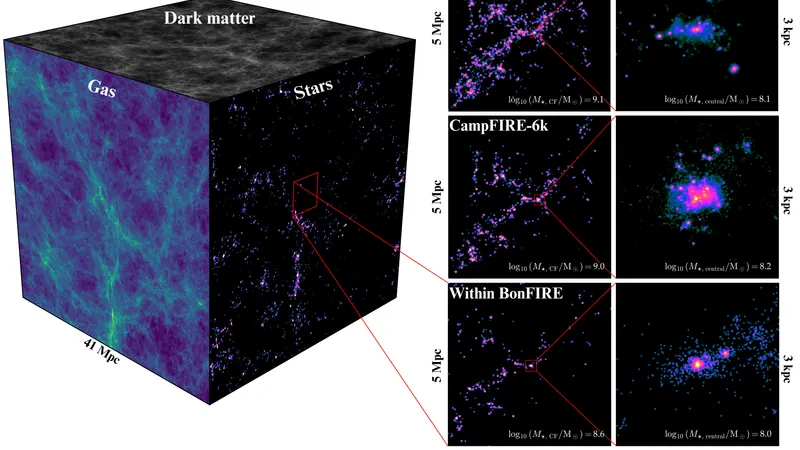
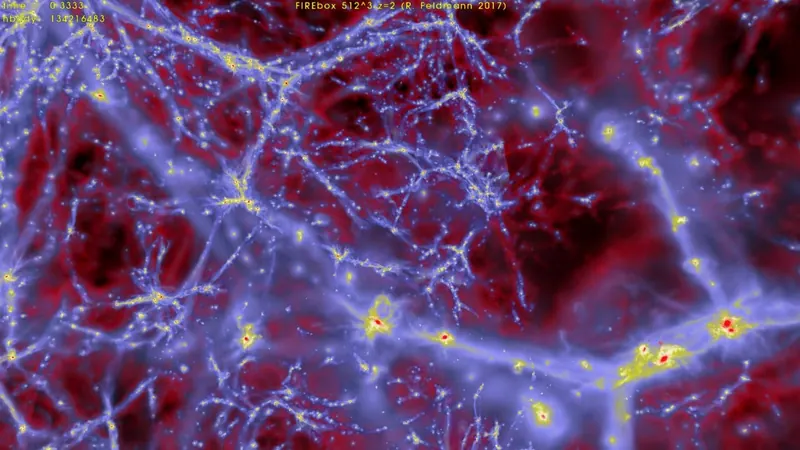
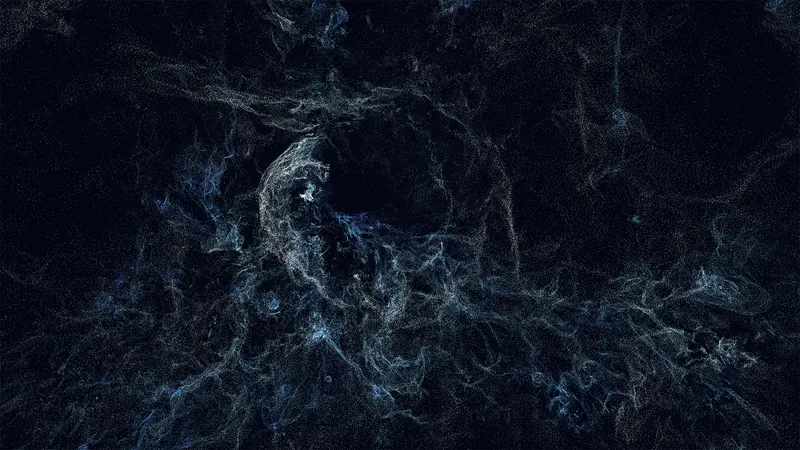
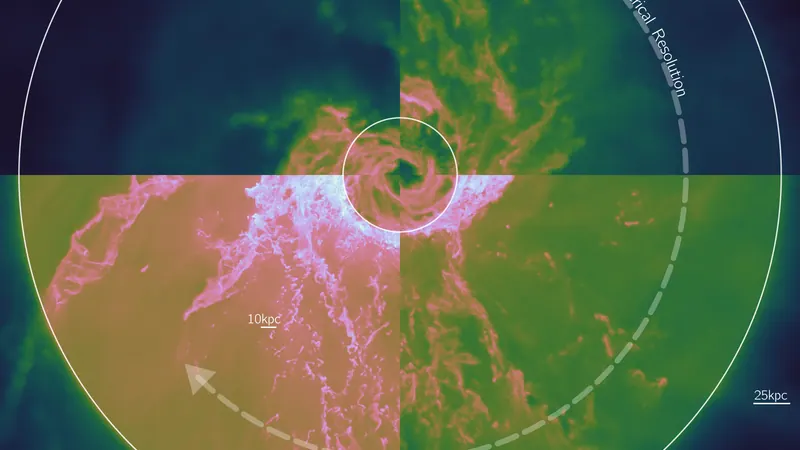
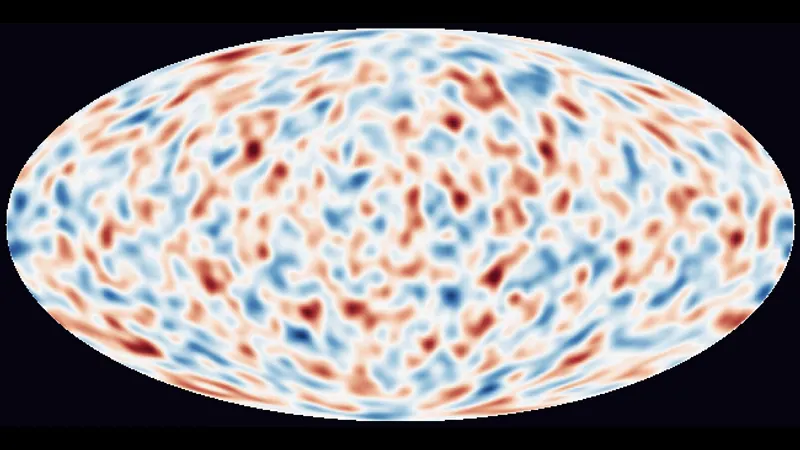
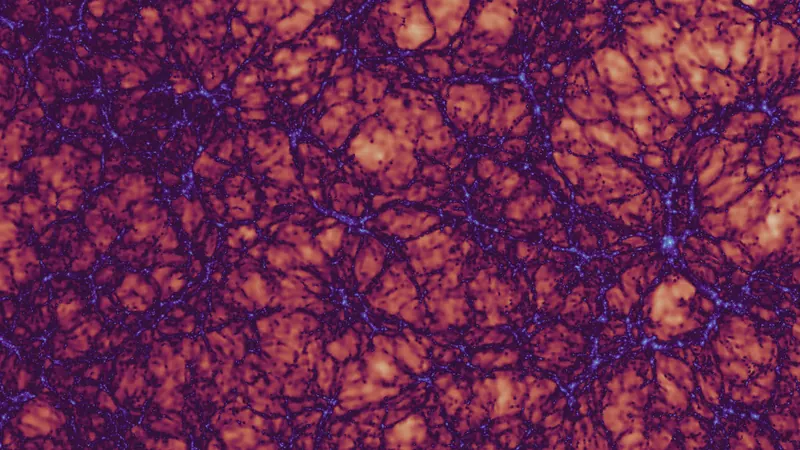
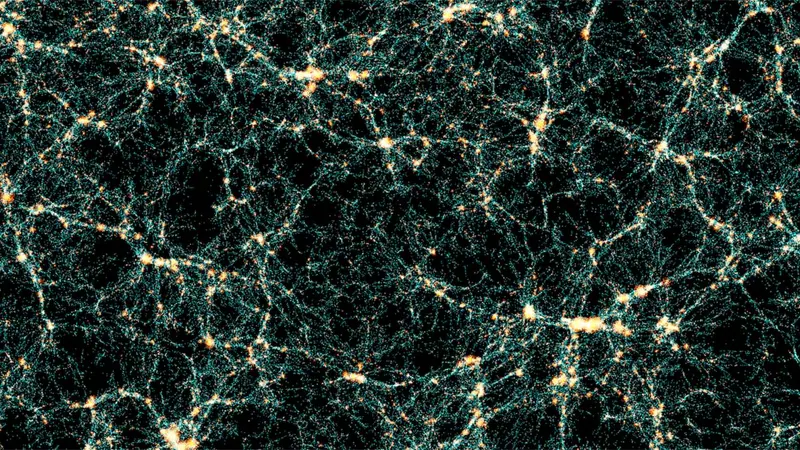
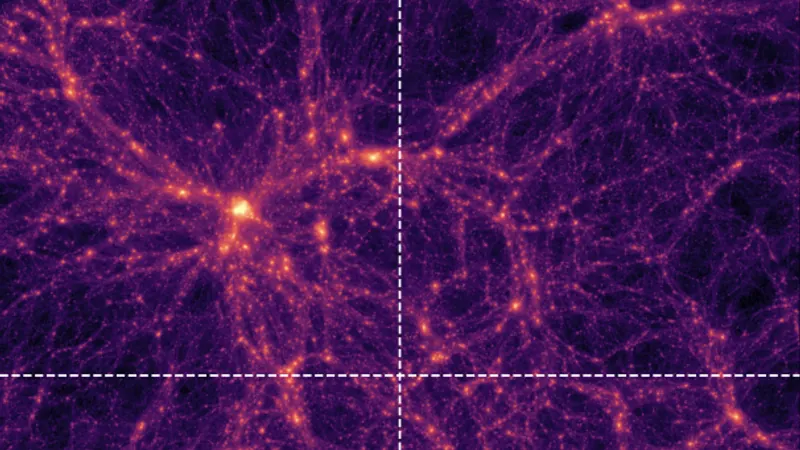
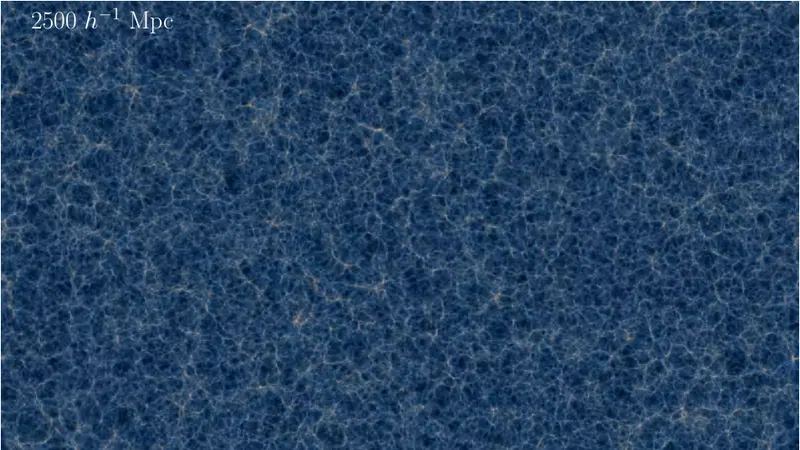
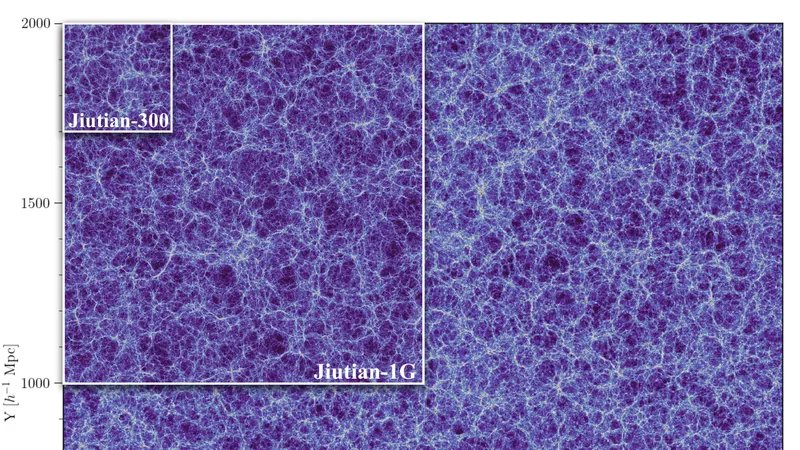
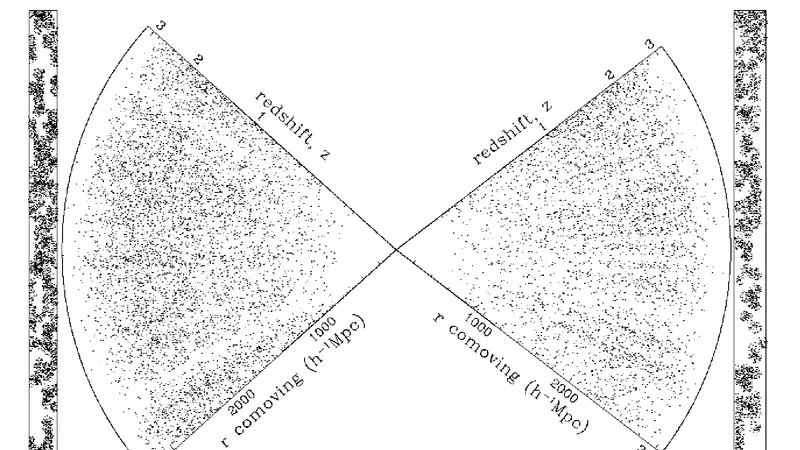
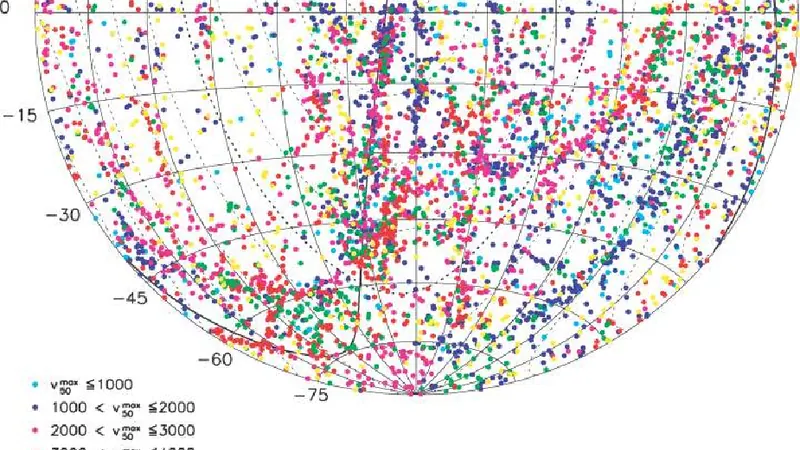
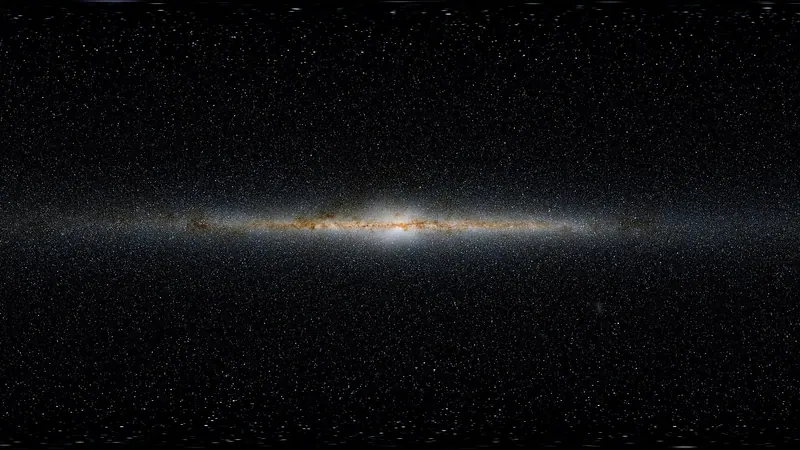
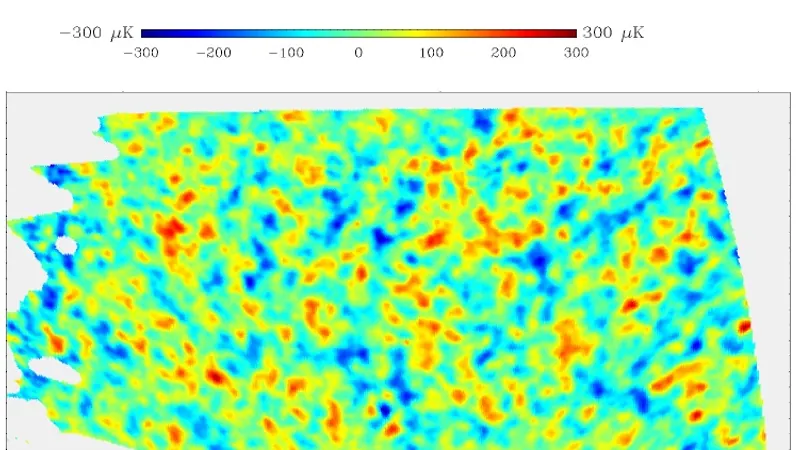
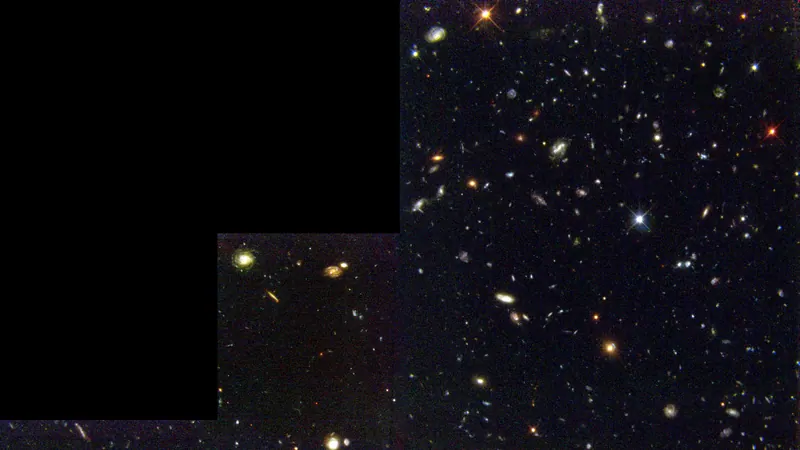
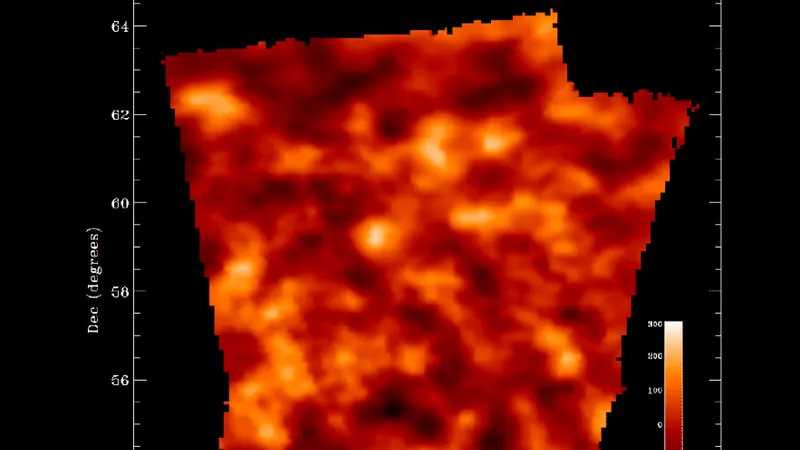
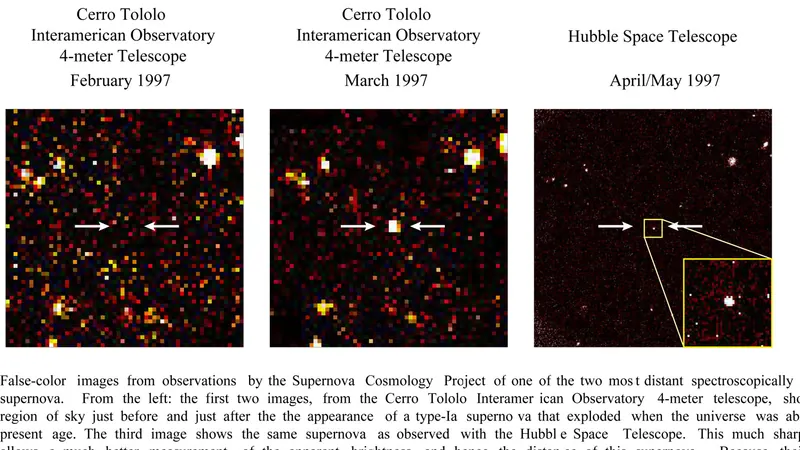
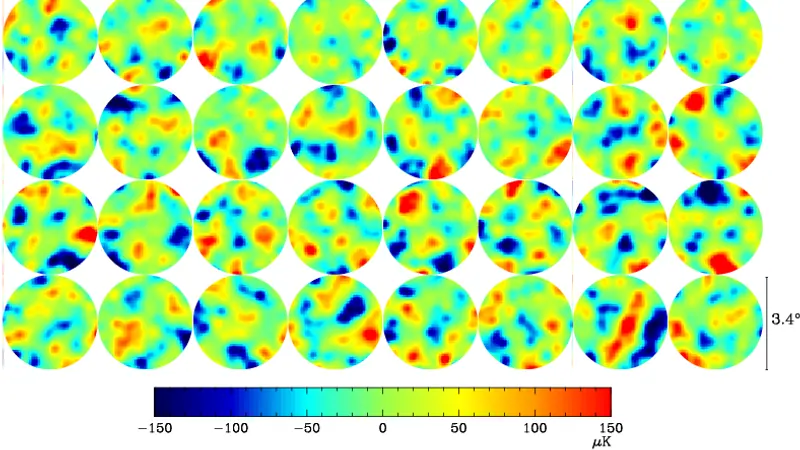
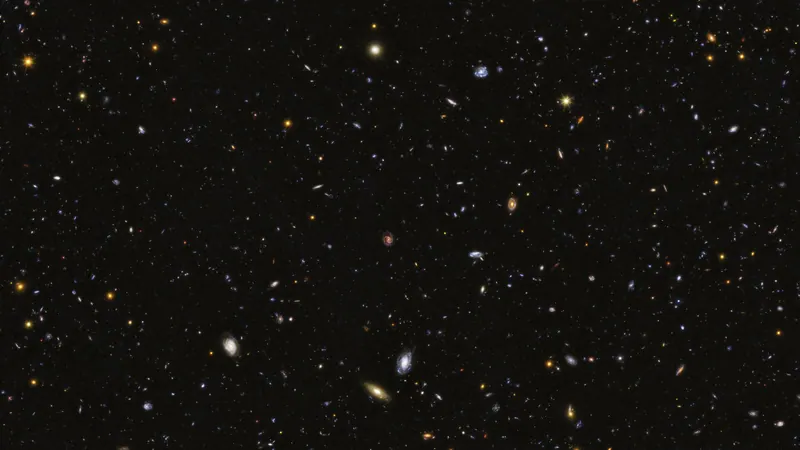
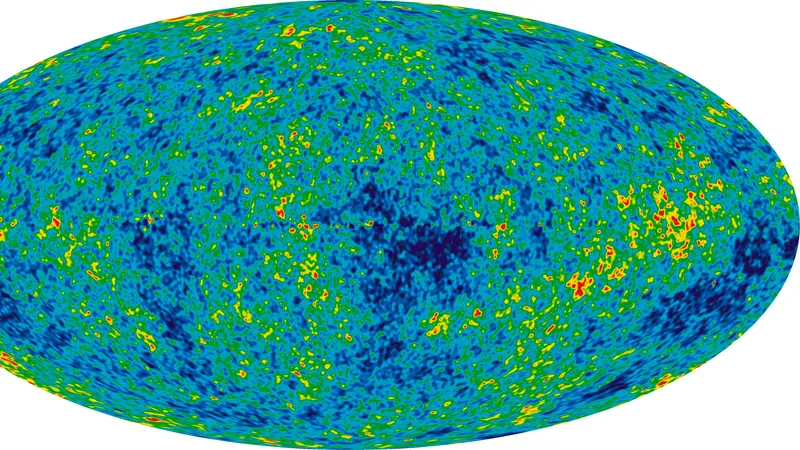
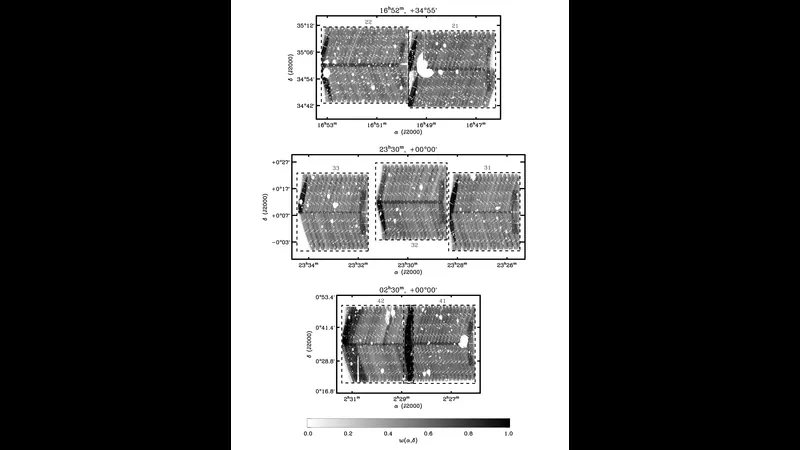
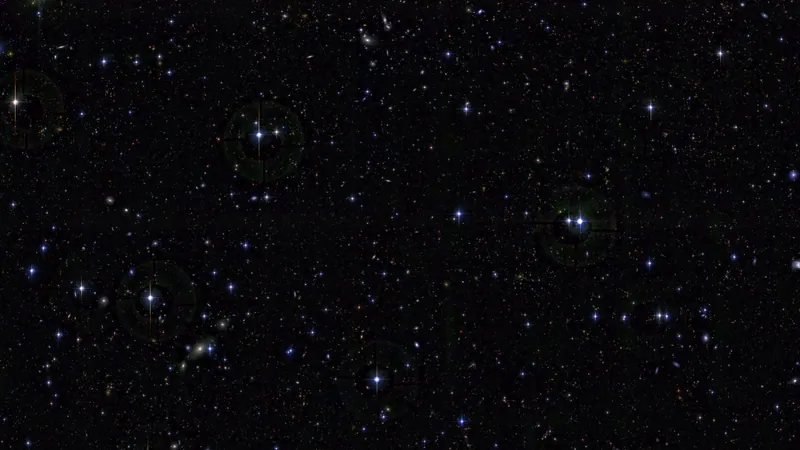
No one will ever watch a galaxy form. It takes billions of years, and we arrived late. So we build universes
instead, out of particles and equations, and run them forward on the largest machines we have, to see whether
what grows there looks like the sky.
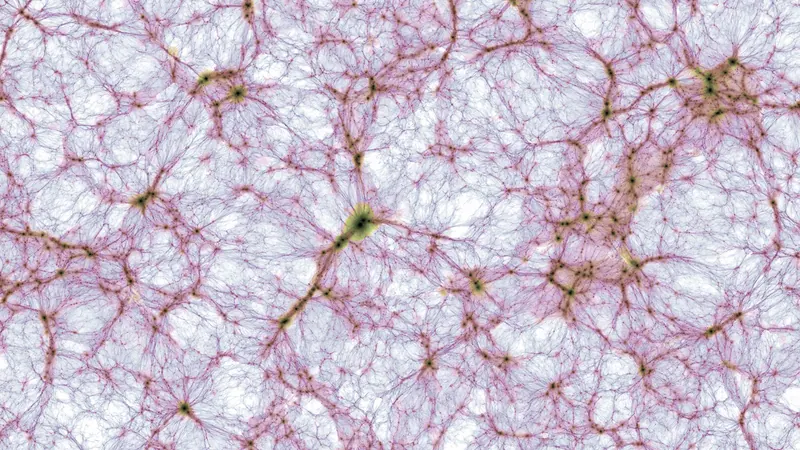
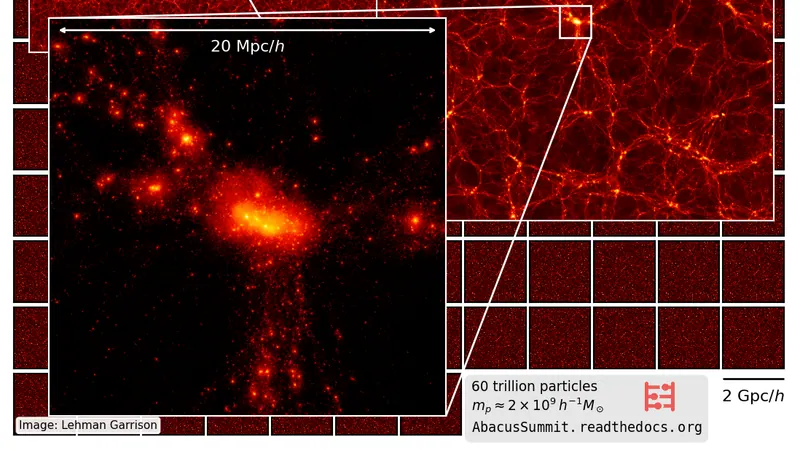
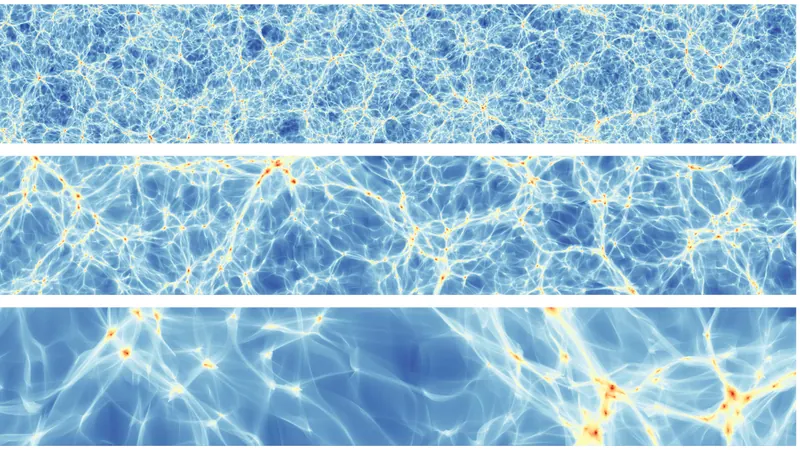
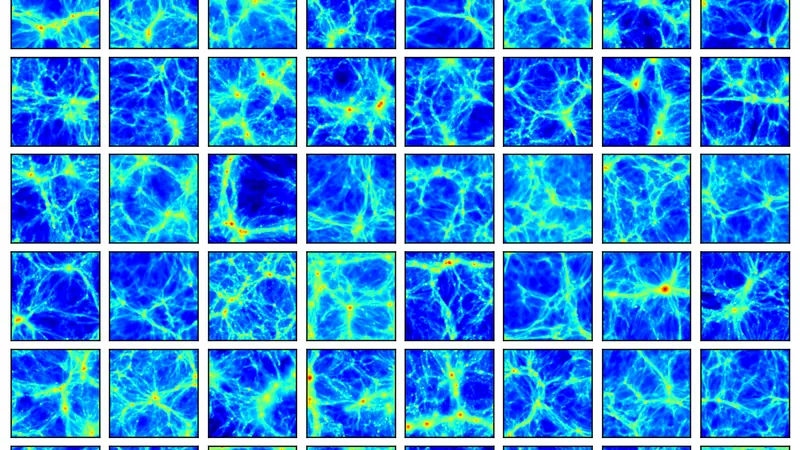
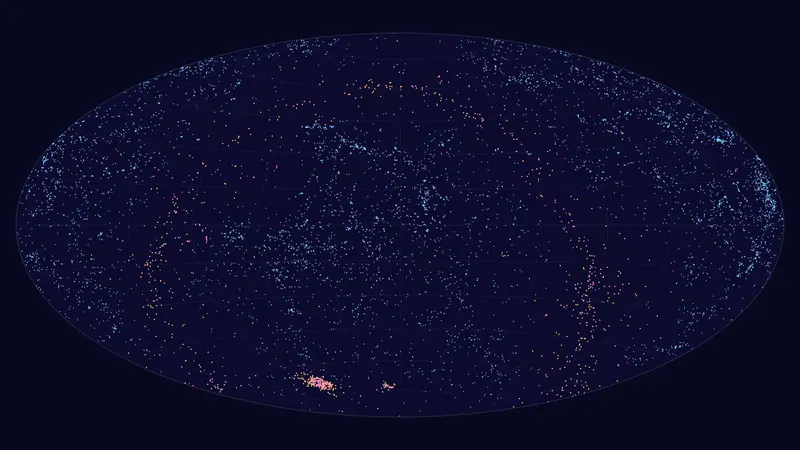
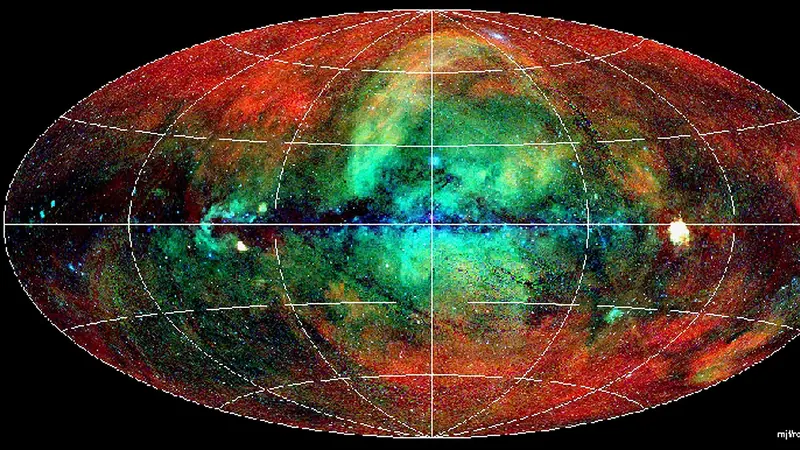
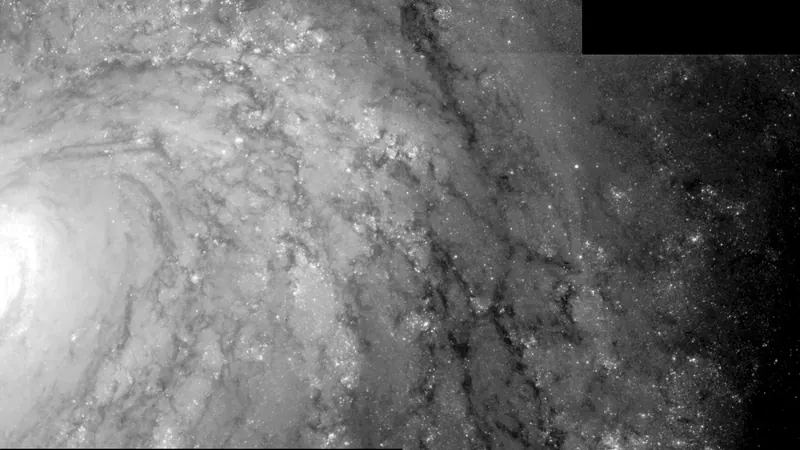
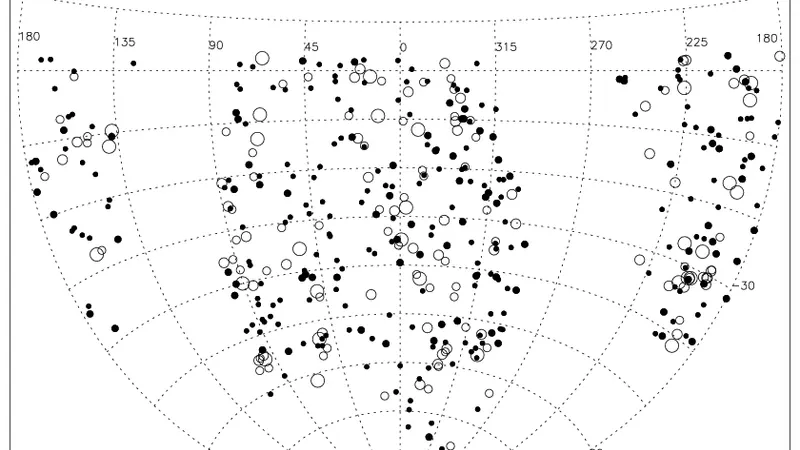
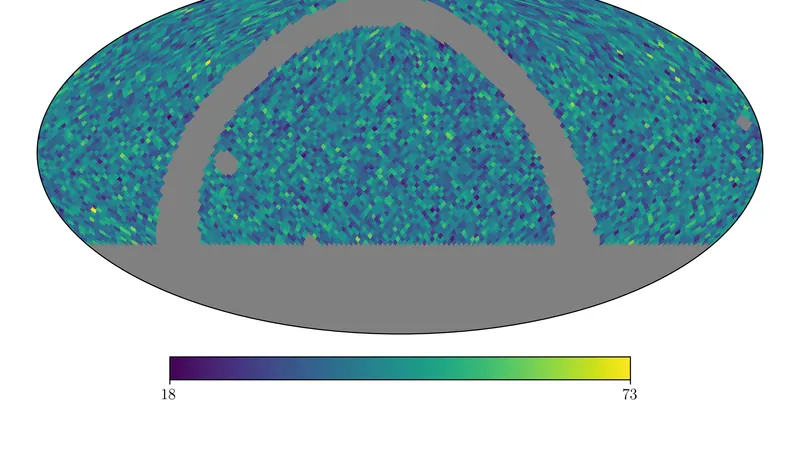
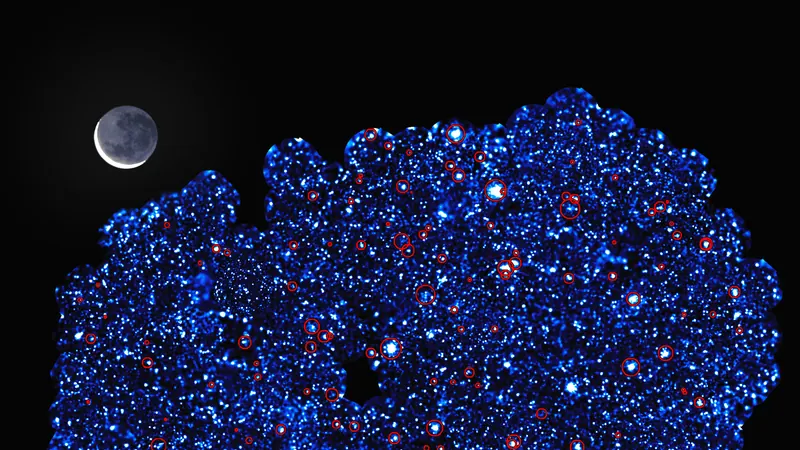
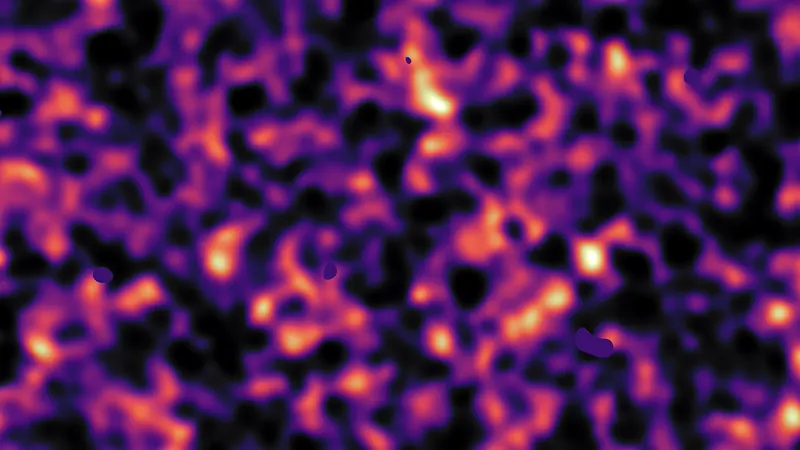
This is a gallery of those universes: 166 entries: simulations, their ancestors and the codes that run them,
beside the 103 surveys of the real sky they are held up against.
The Universe Being Simulated
Before the machines, the thing they imitate: what galaxies are, how many there are, and how they were found to
gather into the largest structures known.
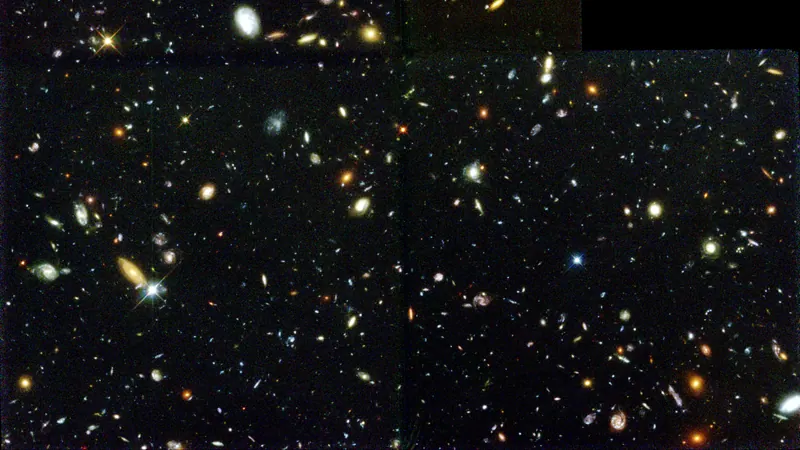
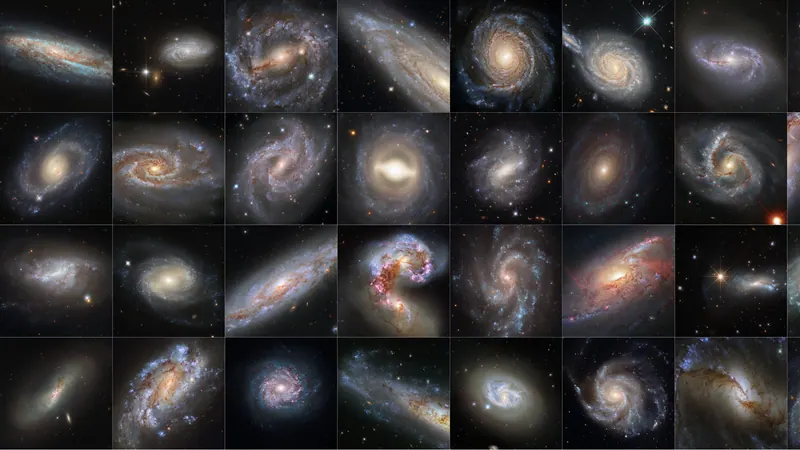
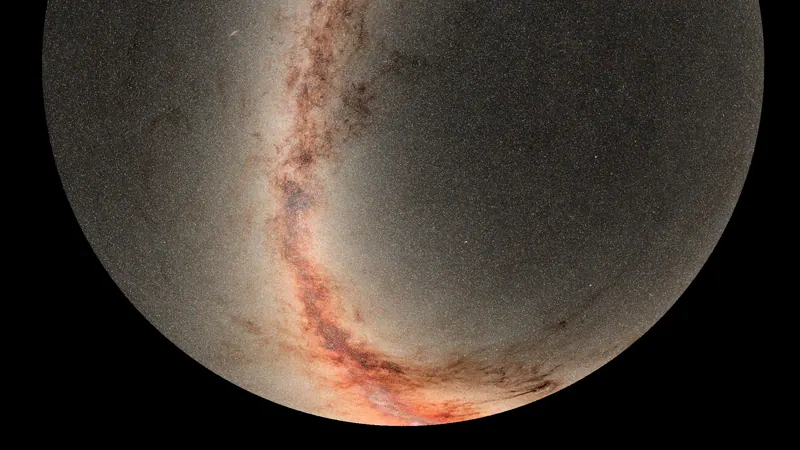
Island UniversesFor a thousand years, faint smudges of light hung in the sky. In 1925 they turned out to be other galaxies, millions of light-years away.
On a dark night, without any instrument, three smudges can be seen that are not stars. In the north, a
faint oval in Andromeda. In the south, two pale clouds, as if torn from the Milky Way. People have looked
at them for as long as there have been people. For a thousand years after al-Sufi wrote down the first,
no one knew what they were.
964al-SufiThe Book of Fixed Stars records Andromeda as a “small cloud”: the oldest known written mention of another galaxy.
1502–1522Vespucci, PigafettaEuropean sailors describe the two clouds of the southern sky, long named and storied by Aboriginal Australian and Māori peoples.
1750–1755Wright, KantFaint nebulae might be whole systems of stars like our own: the idea later called island universes.
1771–1781MessierA catalogue of fuzzy objects so comet hunters would not be fooled. Andromeda is M31.
1845Lord RosseWith a 1.8 m telescope in Ireland, the first spiral is seen and drawn: M51, the Whirlpool.
1912Henrietta LeavittPulsating stars in the Small Magellanic Cloud reveal a law linking period to brightness: the yardstick for cosmic distance.
1920Shapley and CurtisThe Great Debate: is our galaxy the whole Universe, or one among many?
1925Edwin HubbleCepheids in Andromeda place it far beyond the Milky Way. The Universe is suddenly far larger than our galaxy.
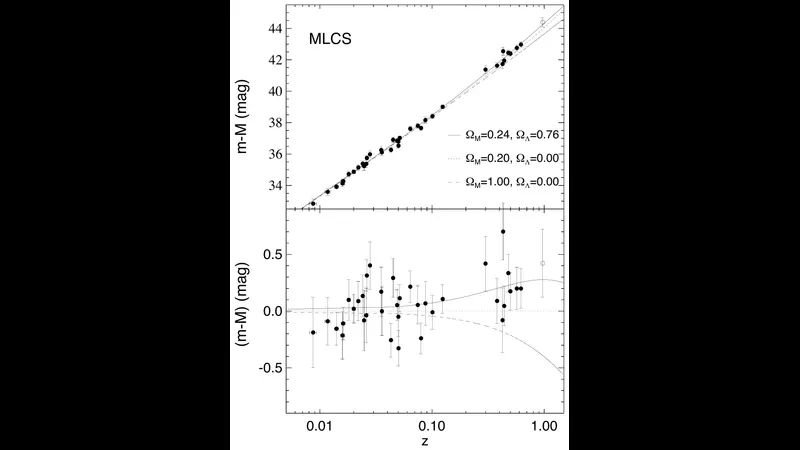
1927–1929Lemaître, HubbleThe farther a galaxy, the faster it recedes. The Universe is expanding.
The answer, when it came, was vertiginous. Andromeda is a city of about a trillion stars, some 150,000
light-years wide, whose light left it about 2.5 million years ago. The Magellanic Clouds are smaller
galaxies orbiting ours, 160,000 and 200,000 light-years away. And the Milky Way itself, a disc about
100,000 light-years across with a few hundred billion stars, is one galaxy among a number that would take
another century to estimate.
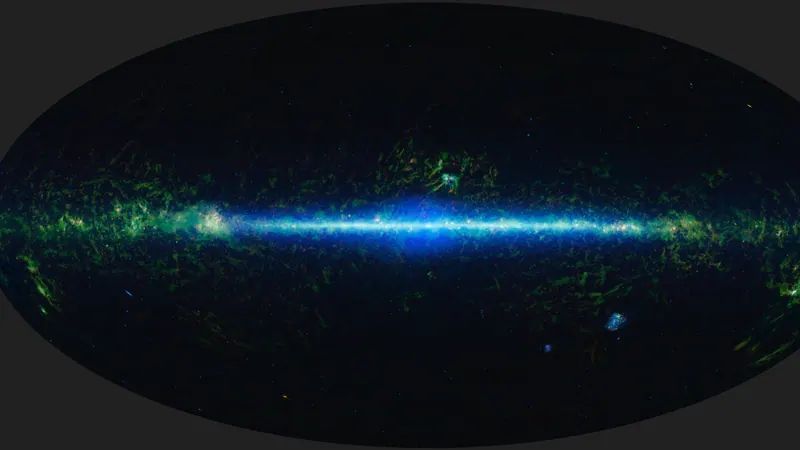
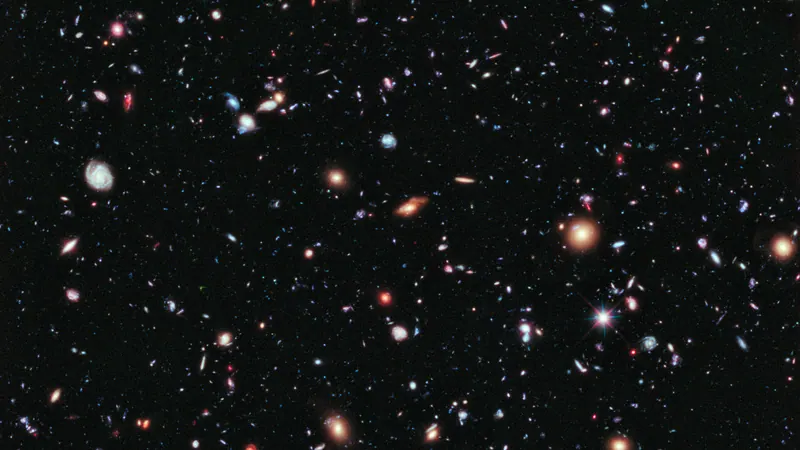
A Census of Everything We Can See13.8 billion years, hundreds of billions of galaxies, perhaps a trillion trillion stars, and most of the mass invisible.
Everything below lies inside our past light cone: the part of the Universe whose
light has had time to reach us. These are the numbers every simulation is built to reproduce.
Age
13.8billion years
Planck 2018: 13.787 ± 0.020
Observable radius
46.5billion light-years
Larger than the age, because space stretched while the light travelled
Galaxies
1011–1012
Hundreds of billions (New Horizons, 2021) to about two trillion (Conselice and colleagues, 2016)
Stars
1022–1024
A rough product of stars per galaxy and galaxies
Atoms
~1080
About 1.5 × 1053 kg of ordinary matter, an order-of-magnitude estimate
Oldest light
2.725kelvin
The cosmic microwave background today, released at redshift 1,090
What the Universe is made of today (Planck 2018)
68.5%dark energy26.5%dark matter4.9%
4.9% ordinary matter: every star, planet, cloud and person
Where the ordinary matter is (Fukugita and Peebles 2004)
6%4%~89% thin gas between galaxies
6% in stars 4% hot gas in clusters
Dark matter outweighs ordinary matter by about five to one, and most ordinary matter is not in stars at all
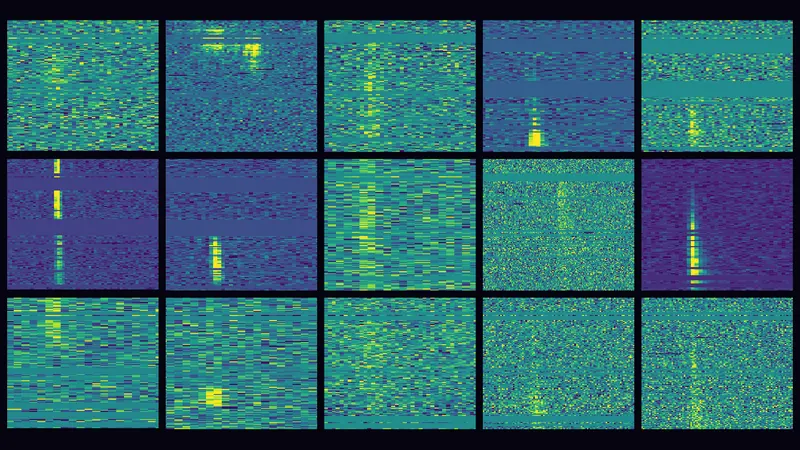
but in thin gas between galaxies, so faint it was counted only in 2020, using the delay of fast radio bursts
crossing it. The two great uncertainties are spelled out on purpose. The number of galaxies depends on how
many faint dwarfs exist beyond what any telescope sees; the latest measurements lean toward hundreds of
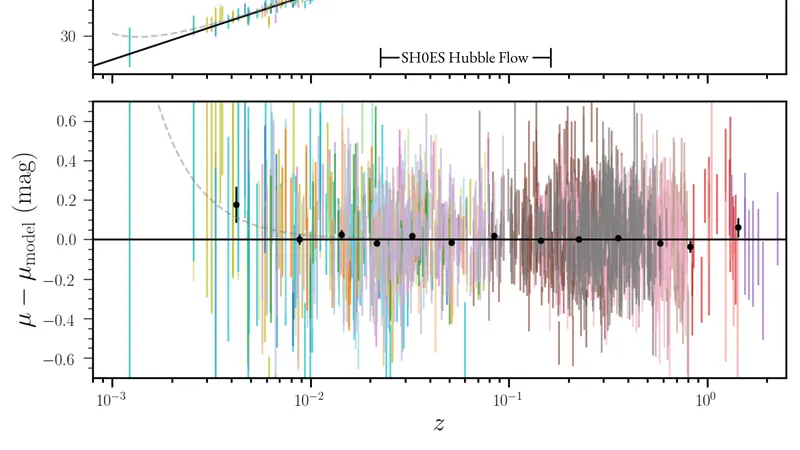
billions. And the expansion rate measured nearby, about 73 kilometres per second per megaparsec, disagrees
with the 67 inferred from the early Universe: the Hubble tension, still unresolved.
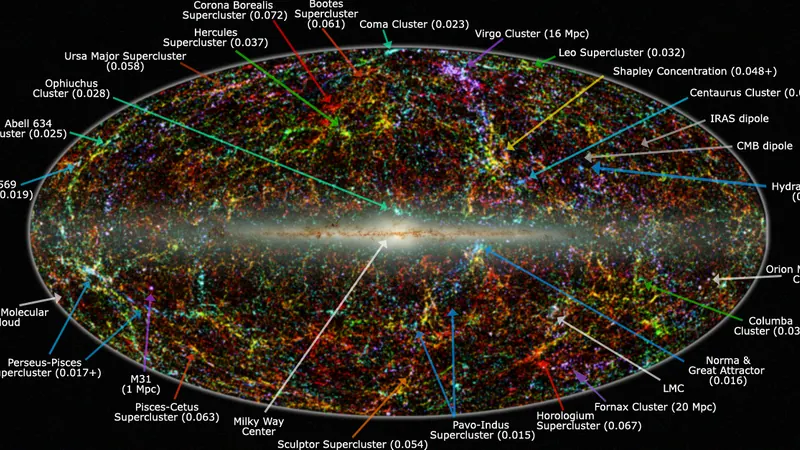
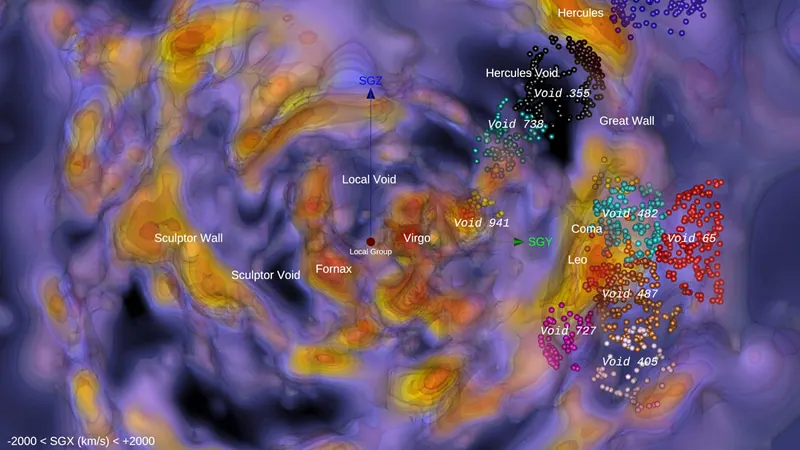
The Architecture of the SkyFrom Shapley's cloud of galaxies in 1930 to Laniakea, our home supercluster: how the cosmic web was found.
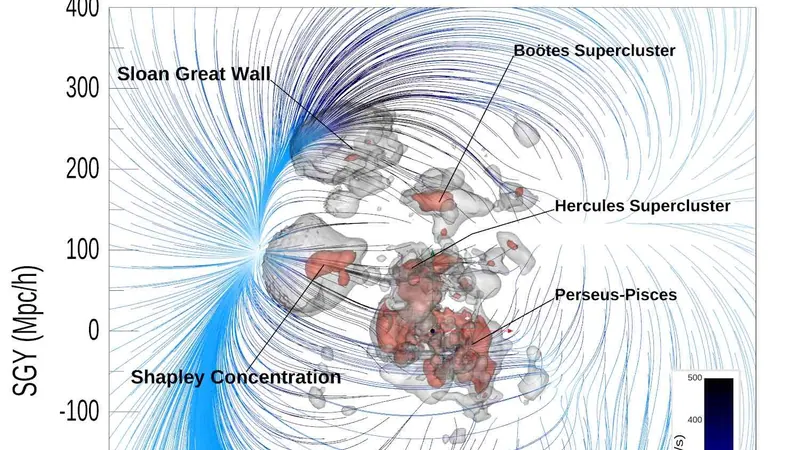
Galaxies are not scattered like dust. Throughout the twentieth century, each new survey found larger
patterns: clusters, then superclusters, then voids and walls, then
flows of galaxies converging on hidden masses.
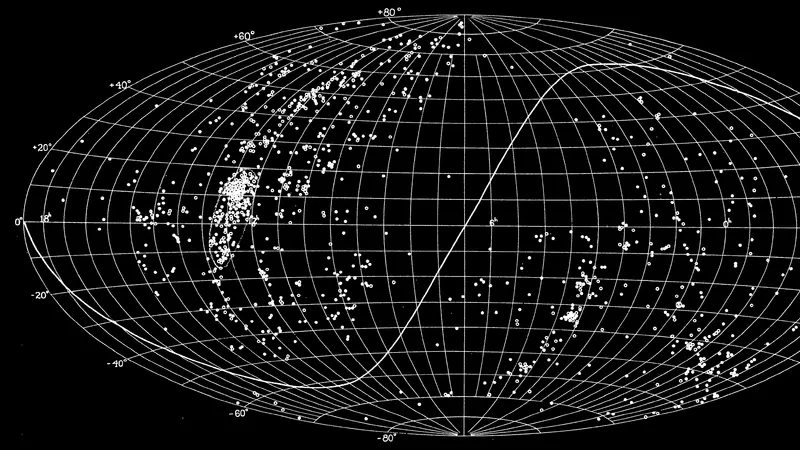
1930Harlow ShapleyA southern survey finds “the most striking concentration of galaxies” in Centaurus, today the Shapley Supercluster.
1933Fritz ZwickyGalaxies in the Coma cluster move too fast for the visible mass to hold them. He calls the missing mass “dunkle Materie”.
1953Gérard de VaucouleursThe crowd of galaxies around Virgo is a flattened super-system: the Local Supercluster.
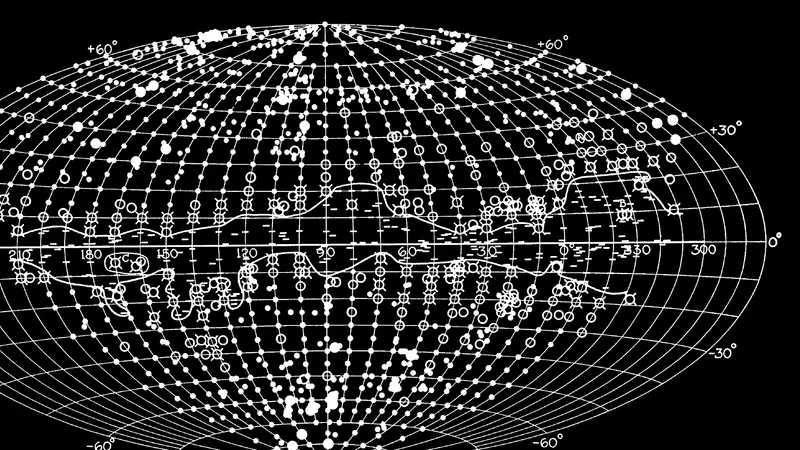
1958George Abell2,712 rich clusters catalogued from the Palomar plates.
1978Gregory and Thompson; Jõeveer, Einasto and TagoThe first voids: great regions empty of galaxies in front of the Coma supercluster and between southern superclusters.
1981Kirshner and colleaguesThe Boötes Void: a region about 400 million light-years across, nearly empty. Later surveys found about sixty galaxies where some two thousand would be expected.
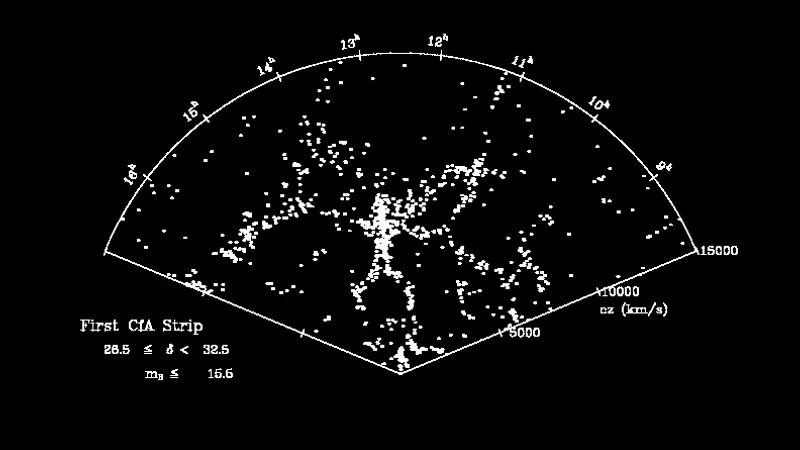
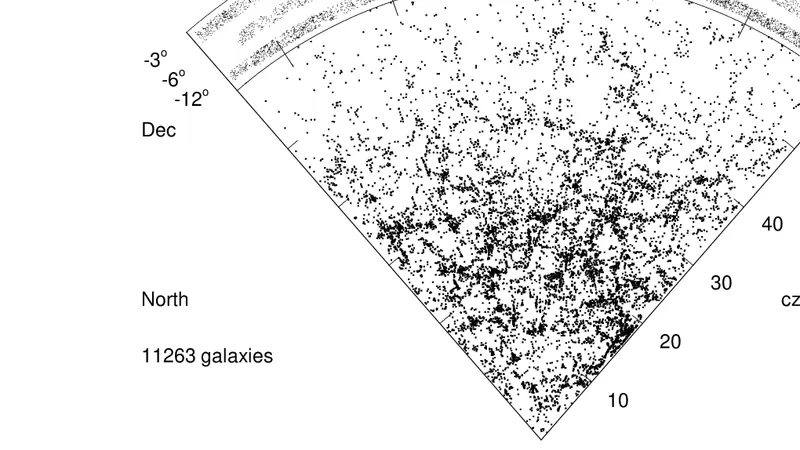
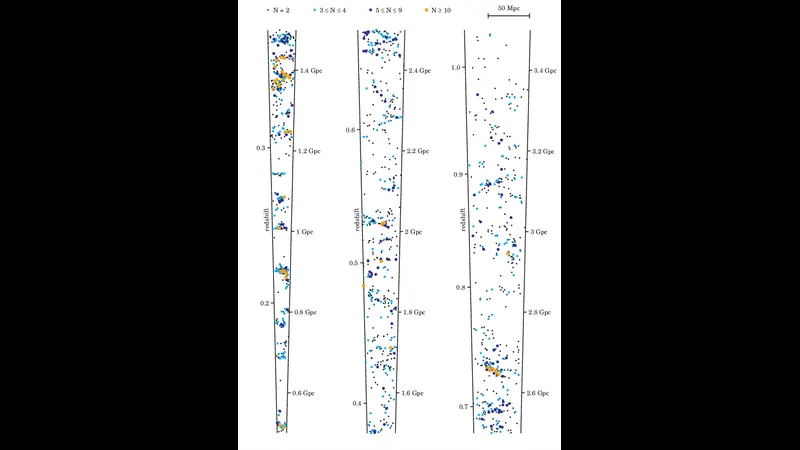
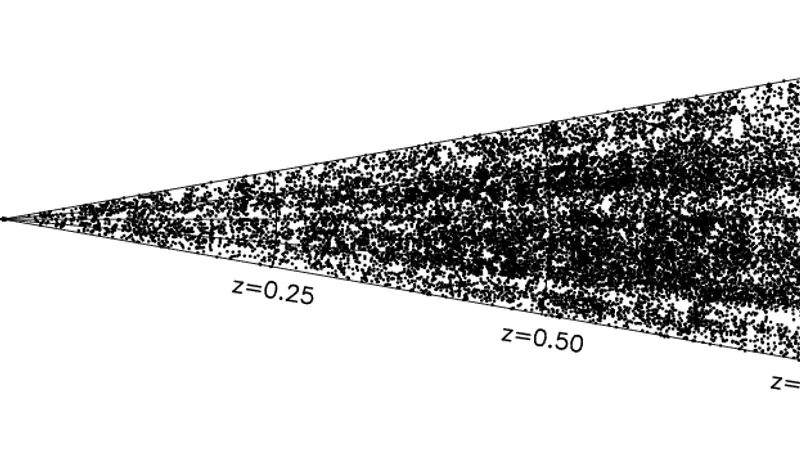
1986–1989de Lapparent, Geller, HuchraA slice of the Universe shows galaxies on the walls of bubbles, and the Great Wall across the northern sky.
1988The “Seven Samurai”Galaxies stream toward a hidden mass behind the Milky Way's disc: the Great Attractor.
2003Gott, Jurić and colleaguesThe Sloan Great Wall, about 1.4 billion light-years long.
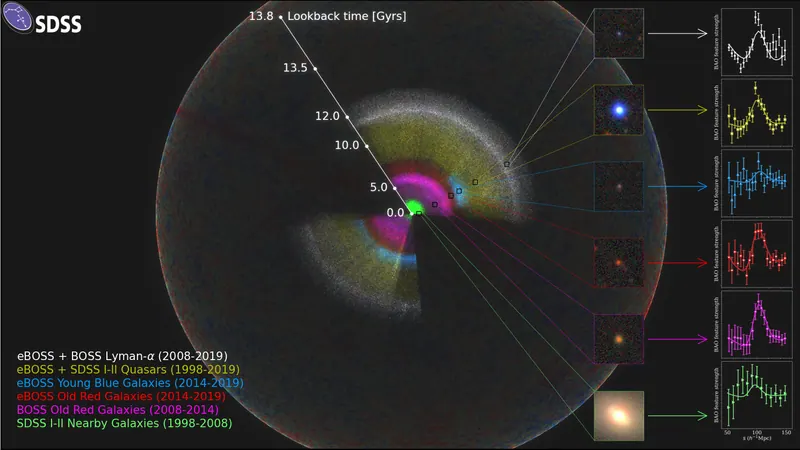
2005SDSS and 2dFGRS teamsBaryon acoustic oscillations: a sound wave from the young Universe, frozen into the spacing of galaxies.
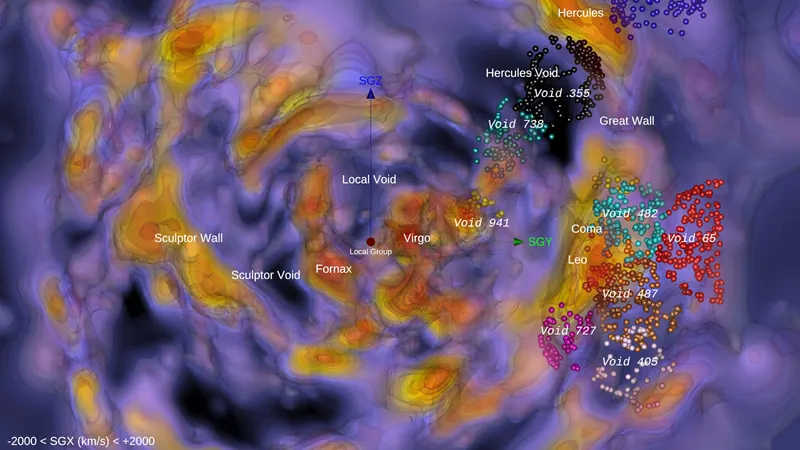
2014Tully, Courtois, Hoffman, PomarèdeMapping galaxy motions defines our home: Laniakea, “immense heaven” in Hawaiian, about 520 million light-years across.
2023Tully, Howlett, PomarèdeHoʻoleilana, “sent murmurs of awakening”, a name from the Kumulipo creation chant: a shell of galaxies about a billion light-years across, some 820 million light-years away, proposed as a single frozen sound wave of the young Universe. A claim still being tested.
2024Valade and colleaguesCosmicflows-4 basins: a slight preference for Laniakea being part of the larger Shapley basin. A hint, not a verdict.
2025Böhringer and colleaguesQuipu, the largest structure yet found in the nearby Universe: about 1.3 billion light-years long.
The search for ever larger structures has a limit. Averaged over spheres about 300 million light-years
in radius, the Universe becomes smooth, the same everywhere: the “end of greatness” measured by SDSS and WiggleZ.
Claims of structures far beyond that scale, like a ten-billion-light-year wall traced by gamma-ray bursts,
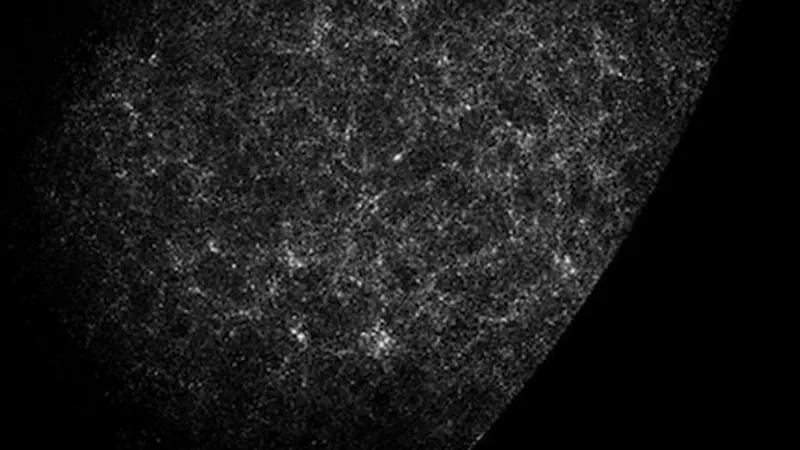
remain contested. This is exactly the regime simulations are built to explore: the cosmic web grows in them from the same rules, and the largest boxes are big enough to
contain the end of greatness many times over.
A Ladder of ScalesFrom our galaxy to the edge of the observable Universe, on one ruler.
Milky Way discabout 100,000 ly across
Distance to the Large Magellanic Cloudabout 163,000 ly
Distance to Andromedaabout 2.5 million ly
Local Superclusterabout 110 million ly across
BAO rulerabout 490 million ly
Laniakeaabout 520 million ly across
Quipuabout 1.3 billion ly long
Observable Universeabout 93 billion ly across
Logarithmic scale: every factor of ten adds the same length to a bar, from 30,000 to 160 billion light-years. ly = light-years.
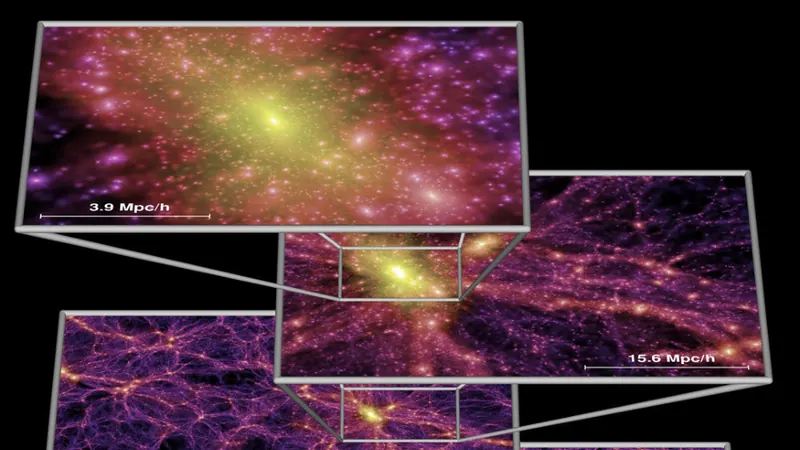
A simulation box sits somewhere on this ladder. The zoom-ins that model a single Milky Way look at the first
rungs; the flagship volumes span the middle; the largest runs reach across billions of light-years, a
sizeable fraction of everything we can see.
A Primer on Simulated Universes
Eight short explainers, from the reason these machines exist to the numbers on each card. Open any one. Underlined
words show their meaning when you point at them.
Why Build a UniverseWe cannot rerun the cosmos or wait billions of years, so we grow copies of it in computers and compare them with the sky.
Astronomy has a peculiar handicap. Chemists can repeat an experiment; biologists can watch a cell divide.
Astronomers get one Universe, seen from one place, at one moment of its 13.8-billion-year history. Every
galaxy we see is a single frame of a film that runs far too slowly to watch.
A simulation turns that frame into a film. Put the right ingredients in a box, apply the laws of physics,
and let the computer run time forward. If the result looks like the real sky, in the number of galaxies,
their shapes, how they cluster, the theory that built it survives. If not, something is missing.
Test theories. The standard model of cosmology, ΛCDM, makes predictions that only a simulation can work out in detail.
Read the sky. To know what a telescope sees, you need to know what a galaxy of a given age and mass should look like.
Rehearse surveys. Missions like Euclid or the Rubin Observatory are tested on mock catalogues before the real data arrive.
Watch the unseeable. Dark matter, the first stars, the slow assembly of the Milky Way: none can be watched directly.
The RecipeStart from the faint ripples of the early Universe, let gravity and expansion act, save snapshots, compare.
SeedsTiny ripples, measured in the cosmic microwave background.
BoxParticles laid on a grid in a comoving cube and nudged by the ripples.
GravityEach step, every particle feels every other while space expands.
PhysicsOptionally gas, stars, black holes, magnetic fields, light.
SnapshotsThe state of everything, saved at chosen moments.
CompareFind halos and galaxies, measure them, hold them up to the sky.
The initial conditions are the one part not invented: their statistics come from
measurements of the early Universe. From there the computer advances in thousands of small time steps, from a
redshift of a few tens to a few hundred down to today. The box wraps around on
itself, so matter leaving one face re-enters from the opposite side, as if the box were one tile of an
endless floor.
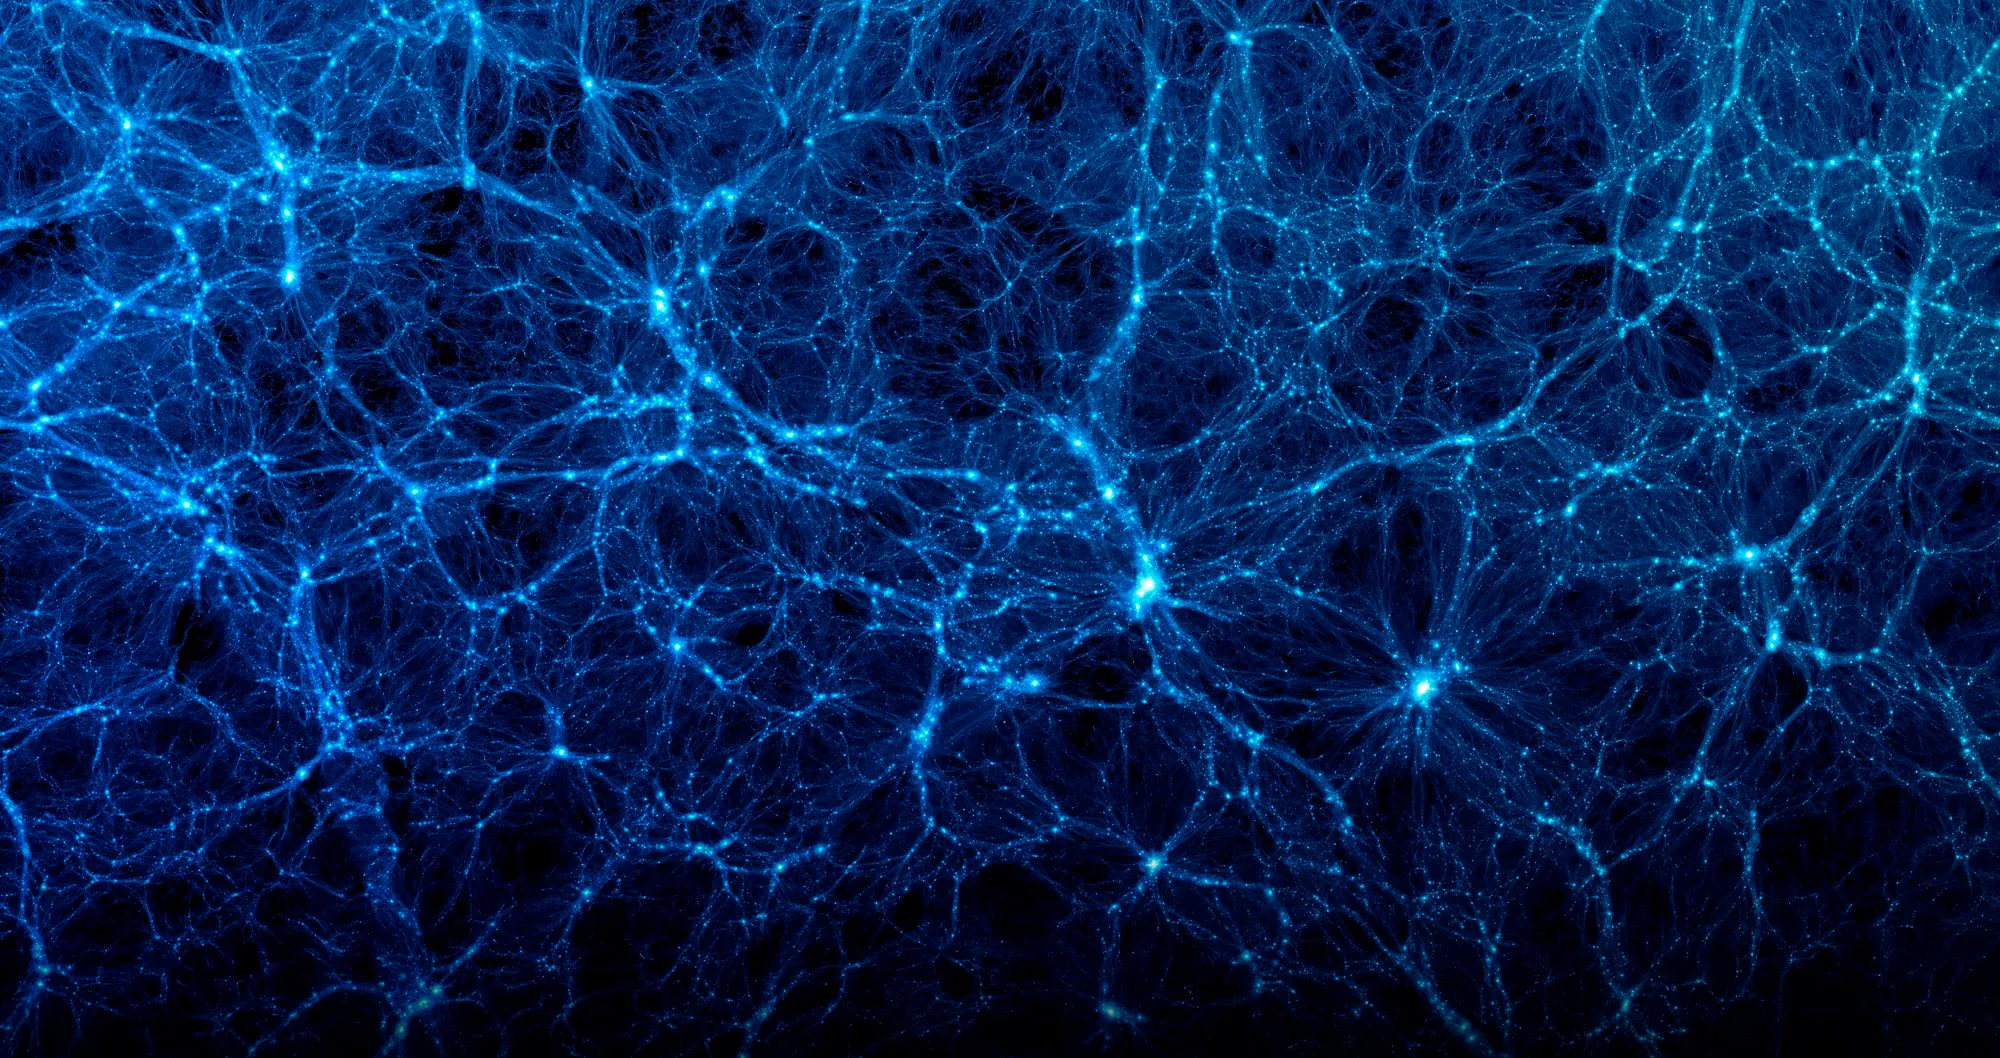
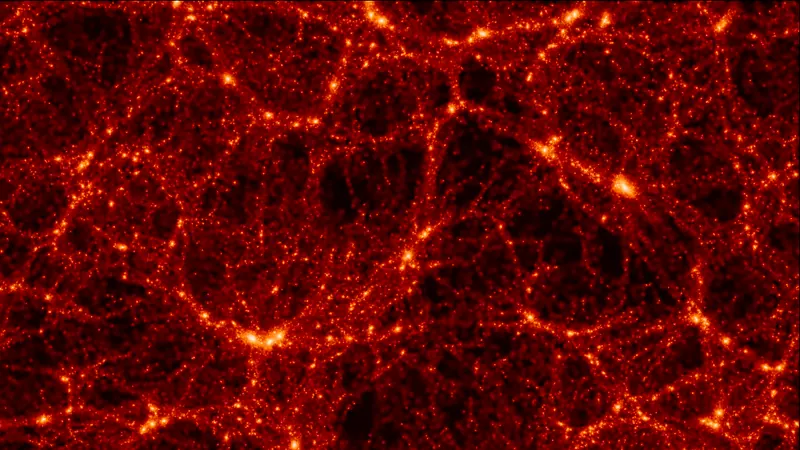
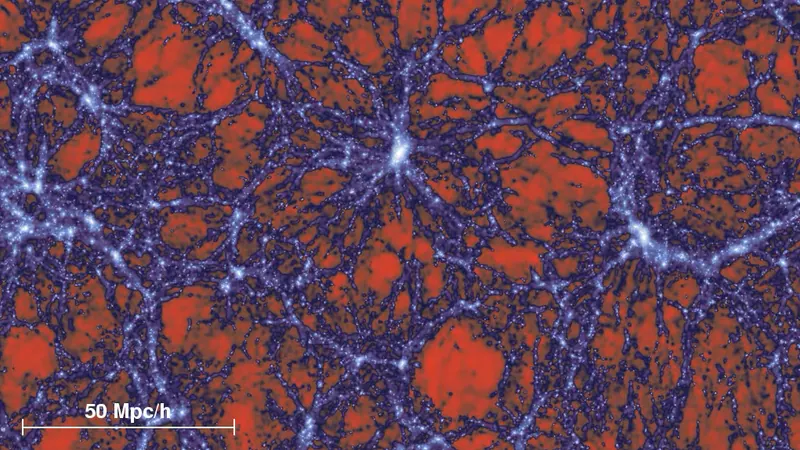
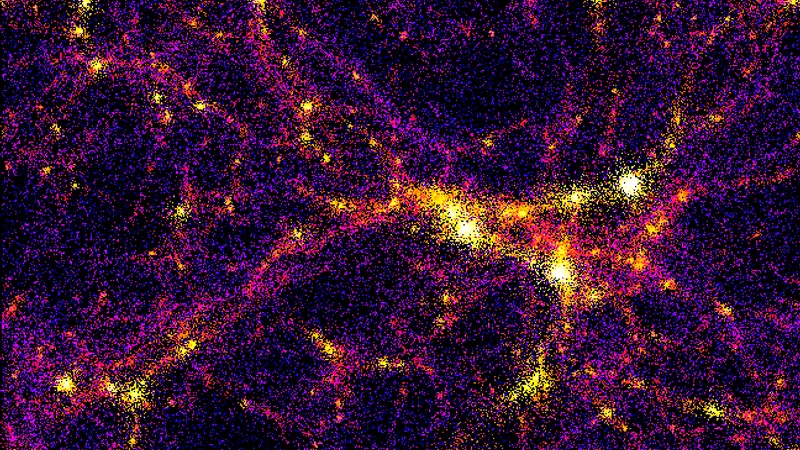
The Invisible ScaffoldingMost matter is dark. Its gravity weaves a web of clumps and threads, and galaxies light up where the threads meet.
About five sixths of all matter is dark matter. Nobody knows what it is, but its
gravity is unmistakable, and in a simulation it does most of the work. Starting almost smooth, it drains out
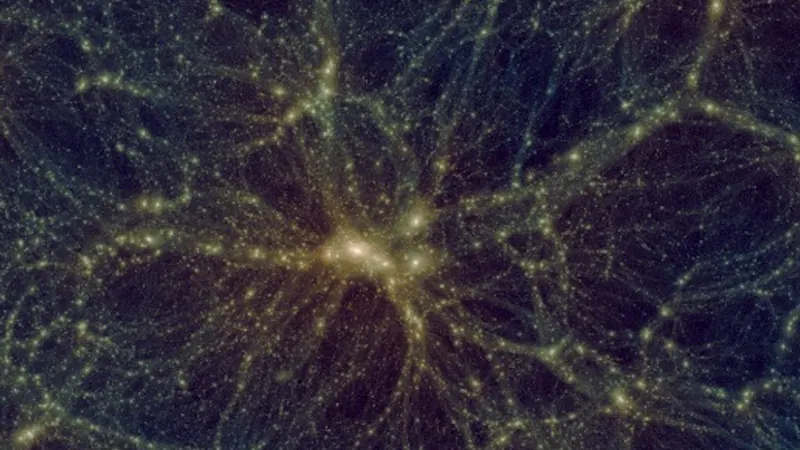
of the emptier regions and piles up in the denser ones. The result is the cosmic web:
round halos at the knots, long filaments between them, and great
voids in between.
Gas follows the dark matter, falls into the halos, cools and forms stars. That is why a dark-matter-only run,
the cheapest kind, can still say a lot about galaxies: it tells you where they will be. Halos merge, and the
small ones that fall into big ones survive for a while as subhalos, the homes of
satellite galaxies.
Particles, Grids, MeshesEvery code chops space or matter into pieces. How it chops decides what it sees well and what it blurs.
N-body particlesParticle-mesh gridTree or adaptive meshMoving mesh
Schematic drawings, not data.
Gravity is the easy physics and the hard sum. With N particles there are about N²/2 pairs, which for ten
billion particles is fifty billion billion. Codes cheat cleverly. A grid computes gravity
in one sweep but blurs anything smaller than a cell. A tree lumps distant particles together
and treats them as one. Most modern codes mix the two (TreePM) or go further with the
fast multipole method.
Gas is harder, because it has pressure, shocks and turbulence. SPH treats it as particles;
adaptive meshes refine a grid where needed; the moving mesh of AREPO
and the meshless schemes of GIZMO sit between. Each leaves its own fingerprint, which is
why the same physics run through two codes never gives quite the same galaxy.
Wide Field or Sharp EyeA computer has a fixed budget: spend it on a huge box seen coarsely, or on one galaxy seen finely.
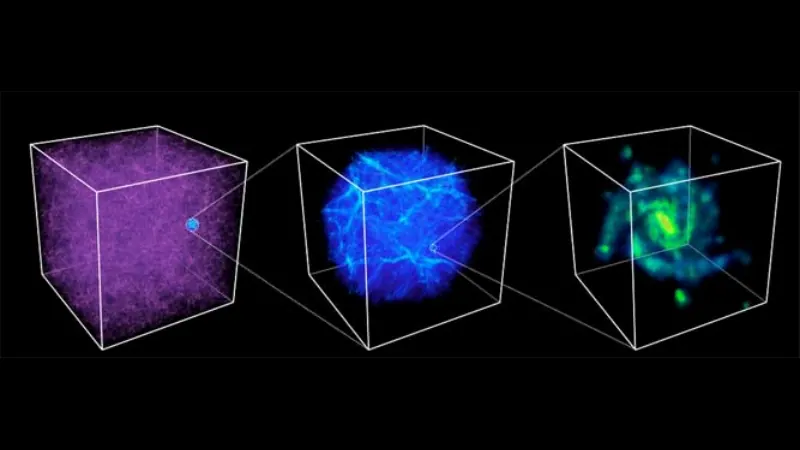
A coarse box, and one region re-run in fine detail: a zoom-in. Schematic.
The number of particles a machine can follow is roughly fixed. Spread them over a box billions of
light-years wide and each particle weighs as much as a whole galaxy: you see the cosmic web, rare giant
clusters, the statistics a survey needs, but no galaxy's inner life. Pack them into a small box and you see
spiral arms and star-forming clouds, but only a handful of objects, and never the rarest ones.
The zoom-in is the way out: simulate a large region coarsely, choose one halo, and re-run
only its surroundings at far higher mass resolution. Aquarius, Auriga, FIRE and many
others are zooms. The big volumes, Millennium, FLAMINGO, Uchuu, give the census. The two kinds need each
other.
What the Grid Cannot SeeStars and black holes are far smaller than a simulation's pixels, so their effects are added by rules. Those rules are where projects differ most.
The sharpest dwarf-galaxy zooms now reach a few suns and form stars one by one, but most cosmological runs have
resolution elements of thousands of suns, and the big volumes millions or more: far coarser than a single star or the region around a black hole. Whatever happens below that scale, a star being born, a
supernova, a black hole swallowing gas, is added through subgrid physics: rules saying,
in effect, "when gas is this dense and cold, turn some of it into stars".
The most important rules concern feedback. Exploding stars and growing black holes
(active galactic nuclei) pour energy back into the gas. Without it, simulated galaxies come out
far too massive and too compact. With it, they start to look right. Most projects calibrate
a few parameters against observations, then treat everything else as a prediction. Others, like FIRE, push
resolution high enough to model individual supernovae more directly. Either way, part of every galaxy
formation simulation is a model, not a law, and the best ones say so plainly.
Reading a CardWhat a box size, a particle count, a redshift and a mass resolution actually tell you.
Box
Side of the cube, usually in megaparsecs, often divided by little h. A thousand megaparsecs is over three billion light-years.
Particles
How many pieces the matter is cut into. Written as a cube when particles start on a grid: 2160³ is about ten billion.
Mass resolution
Mass of one particle, in solar masses. The smaller, the finer the detail.
Runs to
The last moment simulated. Redshift 0 is today; runs of cosmic dawn stop near redshift 5 or 6, when the Universe was about a billion years old.
Compute
Total processor time. The largest runs need tens or hundreds of millions of CPU-hours on national supercomputers.
Softening
Not on every card, but behind every number: below this distance a run's gravity is deliberately blurred.
Open QuestionsSimulations match the large-scale Universe remarkably well. At the smallest scales and in a few measurements, tensions remain.
On large scales the agreement is striking: simulated cosmic webs match the clustering of millions of real
galaxies. Closer in, questions remain. Dark-matter-only runs once predicted many more satellite galaxies, and
denser galaxy centres, than are observed; better feedback and better surveys have softened
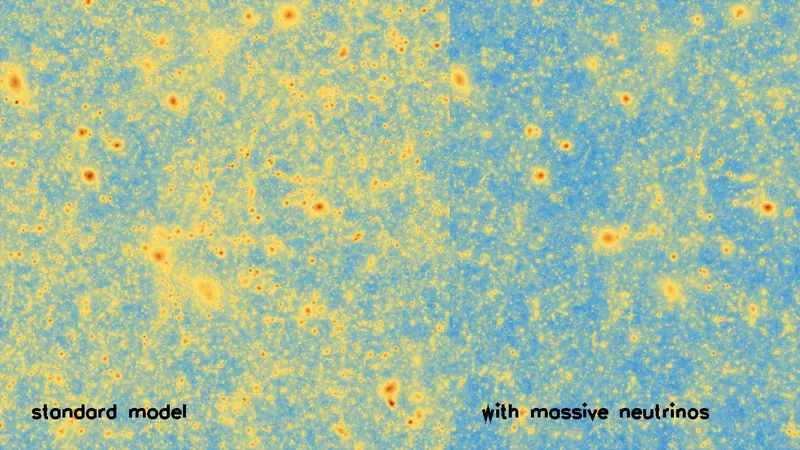
these problems without fully closing them. Some measurements of how clumpy matter is today come out slightly
lower than the early-Universe prediction, a tension simulations with neutrinos
and stronger feedback are now probing.
Cost is the other limit. One flagship run can occupy a national supercomputer for months. That is why the
field now builds suites of hundreds of smaller runs and trains emulators on them, and why
machine learning is beginning to stand in for parts of the computation itself.
COLIBRE · one slab, eight lights
Anatomy of a Simulated Universe
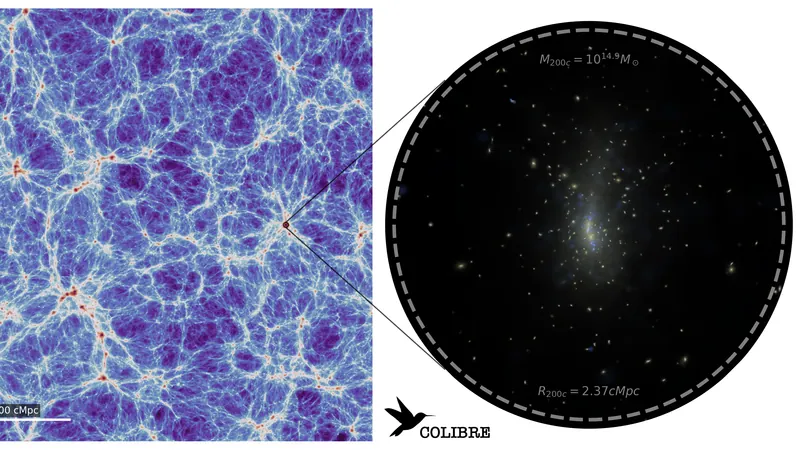
A slice of a simulated universe 400 megaparsecs wide, 1.3 billion light-years, and 10.5 megaparsecs
thick, flattened into one picture. It shows the Universe about 1.3 billion years ago, close to today on cosmic
timescales. Change the light you see it by, compare two lights, and open the structures the web is made of.
50 megaparsecs · 163 million light-years
Light
Where the ordinary matter is. Most of it is thin gas between the galaxies, drawn into the same threads as the dark matter. Bright means dense.
Compare
against
Read the web
Void in a void
Void in a cloud
Void
Wall
Thin filament
Thick filament
Node
Bridges · 46
Filaments · 3290
Tendrils · 623
1 / 8
What you are looking at
Each picture adds up or averages everything in a slab 10.5 megaparsecs deep, as if looking down through a thick sheet of
space. Dark matter has drawn the gas into a web of filaments and knots around wide
voids. The landmarks mark eight kinds of structure; open any of them, or take the tour.
1 · Supercluster
The richest supercluster
110 megaparsecs across
A supercluster is a crowd of clusters and groups strung together, the widest knot in the web. This one gathers 22 of the slab's heaviest nodes.
Size
About 95 megaparsecs end to end, 311 million light-years. It covers 3,459 square megaparsecs of the map.
Count
26 superclusters in this slab.
Found by
Where the dark matter, smoothed over 4 megaparsecs, is more than twice the average density, and the patch holds at least two nodes heavier than 3 × 10¹³ suns.
Method after Einasto and colleagues; outline from GLOBAÏA's typology of this slab.
2 · Node
The heaviest node
14 megaparsecs across
A node is where filaments meet and matter piles up: a halo hosting a cluster or a rich group of galaxies. 8 filaments run into this one; astronomers call that count its connectivity.
Size
5.0 × 10¹⁴ solar masses of dark matter within 1 megaparsec (3 million light-years) of its centre, in a column through the whole slab.
Count
161 nodes heavier than 3 × 10¹³ suns in this slab.
Found by
A round peak where the projected density, smoothed over 0.3 megaparsecs, is more than 40 times the average: roughly what a collapsed cluster looks like through a slab this thick.
Careful
A filament pointing straight at us also looks like a round peak.
Node threshold after Cautun et al. 2013 (NEXUS+), adapted to two dimensions.
3 · Bridge
A bridge between two heavy nodes
13 megaparsecs across
A bridge is a short filament strung between two nodes. This one joins clusters of 1.5 × 10¹⁴ and 1.0 × 10¹⁴ solar masses of dark matter, each counted in a column 1 megaparsec in radius through the slab. In simulations these short filaments are denser and about three times hotter than the long ones.
Size
5.6 megaparsecs long, 18 million light-years.
Count
46 bridges in this slab, every node-to-node link shorter than 9 megaparsecs.
Found by
A stretch of the filament spine joining two different nodes, shorter than 9 megaparsecs. Shown here: the bridge between the heaviest pair of nodes, away from the other landmarks.
Galárraga-Espinosa et al. 2020, 2021 (IllustrisTNG, Illustris, Magneticum).
4 · Filament
The longest filament
29 megaparsecs across
Long filaments are the skeleton of the web, the threads along which gas and galaxies drain toward the nodes.
Size
20 megaparsecs from node to node, 64 million light-years, measured along its spine.
Count
13 node-to-node filaments longer than 9 megaparsecs, and 3277 other filament branches.
Found by
Ridges of the dark-matter map found at four smoothing scales (0.5 to 4 megaparsecs), thinned to a one-pixel spine and cut at every junction.
Careful
A wall seen edge-on draws the same ridge. In this flattened view the two cannot be told apart by shape alone.
Ridge finder after Cautun et al. 2013 (NEXUS+); spine split after Galárraga-Espinosa et al. 2020.
5 · Wall
The widest wall
101 megaparsecs across
Walls, or sheets, are thin membranes of matter stretched between filaments. Here they are the faint veil that is denser than average but neither a ridge nor a peak.
Size
This connected patch covers 328 square megaparsecs of the map.
Count
12% of the map's area and 14% of its dark matter.
Found by
Denser than 80% of the average on a 1 megaparsec scale, yet neither filament nor node. This is the widest connected patch outside the superclusters.
Careful
Walls seen face-on lie flat in the slab and show as this low plateau; walls seen edge-on show as filaments instead.
GLOBAÏA's 2D typology of this slab; walls as real three-stream structures: Hertzsch et al. 2025.
6 · Tendril
The longest tendril
41 megaparsecs across
A tendril is a thin spur of the web that runs out into a void and ends there, like a root.
Size
32 megaparsecs long, 103 million light-years.
Count
623 tendrils in this slab.
Found by
A thin branch (at most 1 megaparsec wide) with a free end, in a region below average density.
Named by Alpaslan et al. 2014 in the GAMA galaxy survey.
7 · Void in a cloud
The widest void in a cloud
64 megaparsecs across
A void closed in by so much matter that its surroundings, out to three times its radius, are denser than average. Voids like this are expected to be squeezed shut over time.
Size
An effective radius of 24 megaparsecs, 80 million light-years.
Count
156 voids of this kind in this slab, out of 398.
Found by
A watershed basin of the density map, whose average density within three radii is above the mean.
Sheth and van de Weygaert 2004; Ceccarelli et al. 2013 (S-type voids).
8 · Void in a void
The widest void in a void
75 megaparsecs across
Emptiness inside a wider emptiness. Nothing around this void is dense enough to close it, so it keeps expanding.
Size
An effective radius of 29 megaparsecs, 94 million light-years.
Count
242 voids of this kind in this slab, out of 398. Voids fill 70% of the map and hold 19% of its dark matter.
Found by
A watershed basin whose average density within three radii stays below the mean.
Sheth and van de Weygaert 2004; Ceccarelli et al. 2013 (R-type voids).
How much of what
Share of this slab's area and dark matter in each class, beside the most quoted three-dimensional census.
Area hereVolume, 3DMass hereMass, 3D
Voids70%77%19%15%
Walls12%18%14%24%
Filaments17%6%40%50%
Nodes<1%<1%27%11%
This slab: GLOBAÏA's typology, in which filaments include walls seen edge-on. 3D: NEXUS+, Cautun et al. 2014.
A flattened view
The picture adds up or averages 10.5 megaparsecs of depth. A wall seen edge-on draws the same bright line as a filament, and a
filament pointing at us looks like a round knot. Shape alone cannot settle it. Heat, X-rays and the microwave
shadow help: hot ridges are more likely filaments, cool ones more likely walls, though that rule is an
expectation and not a measured COLIBRE result.
The classes depend on the method
Twelve methods run on one simulated box agreed on the voids and on little else: the share of mass they put in
filaments ranged from 11% to 62% (Libeskind et al. 2018). Even with full 3D information, a neural network trained
to sort galaxies tells walls from filaments far less reliably than it spots voids (Inoue et al. 2022).
The classes here are one careful reading, adapted to two dimensions, not a fact of nature.
The simulation
COLIBRE follows dark matter, gas, stars and black holes. The maps we received come from three boxes, 25, 200 and 400 megaparsecs wide, with gas allowed to
cool far below ten thousand degrees. The coldest pixels here are the emptiest voids, where gas cools as it expands. This is the largest box,
L400m7, seen at redshift 0.1. Each map pixel of the original is 3 kiloparsecs wide; the picture
here is up to 4,096 pixels across.
Each dot is a simulation, placed by year and by how many particles it followed, on a logarithmic scale where every line is a hundred times the one below. Drag across the chart to keep only those years.
Years before 1995 are compressed into the first 25% of the axis.
Ancestors
Dark matter volumes
Zoom-ins
Galaxy formation
Clusters
Cosmic dawn
Star formation
Suites & emulators
Codes
Ancestors·1941Milestone
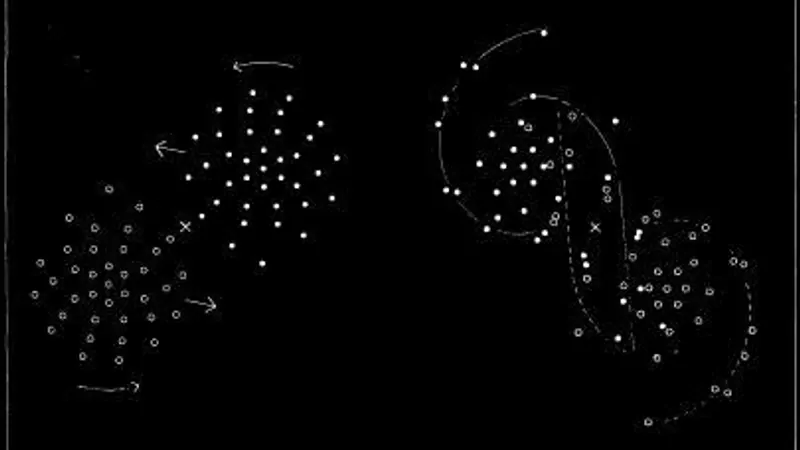
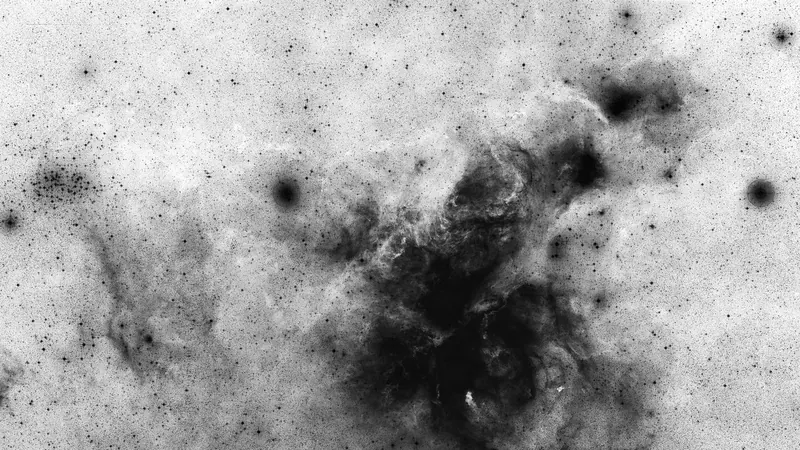
Image: Erik Holmberg (1941), ApJ, as reproduced on the page (caption: Bulb computer) (tones inverted)
Particles
74
Machine
Light bulbs and photocells
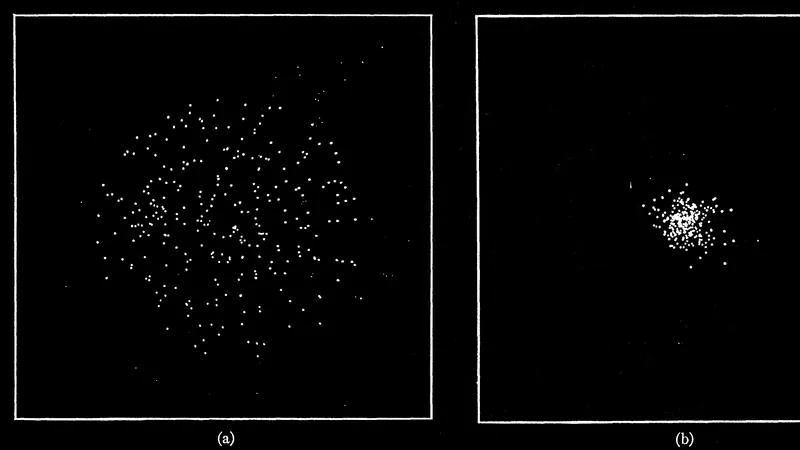
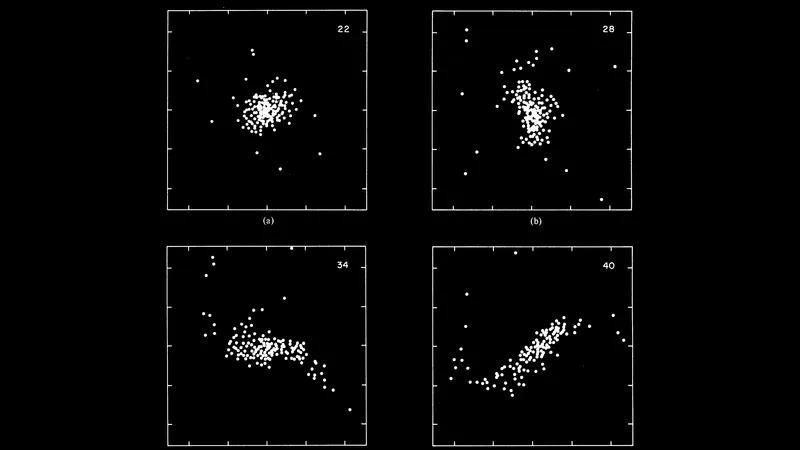
In 1941, long before computers could do the sums, Erik Holmberg built two galaxies out of light bulbs, 37 for each. Light fades with distance the same way gravity does, so a photocell measuring the glow around each bulb told him which way that star would be pulled next. Moving the bulbs step by step, he watched his passing galaxies grow spiral arms.
Erik Holmberg modelled two colliding flattened galaxies with light bulbs, using light as a stand-in for gravity, decades before computers could do it.
Each galaxy was 37 light bulbs; a photocell measured the total light, standing in for gravitational pull, and the encounter grew spiral arms.
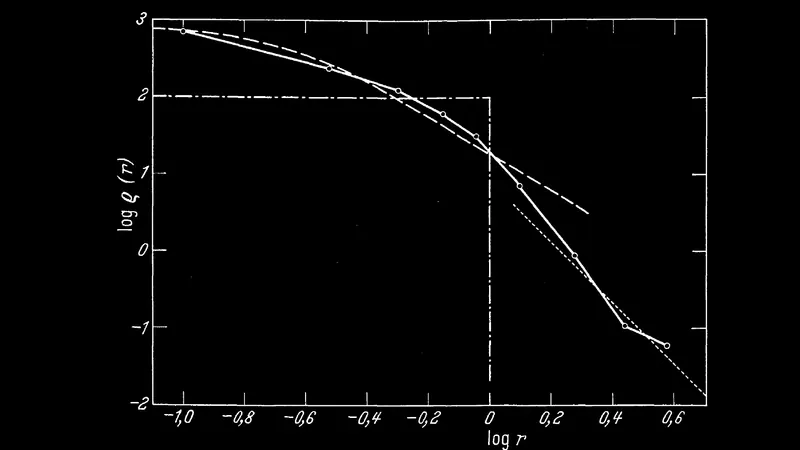
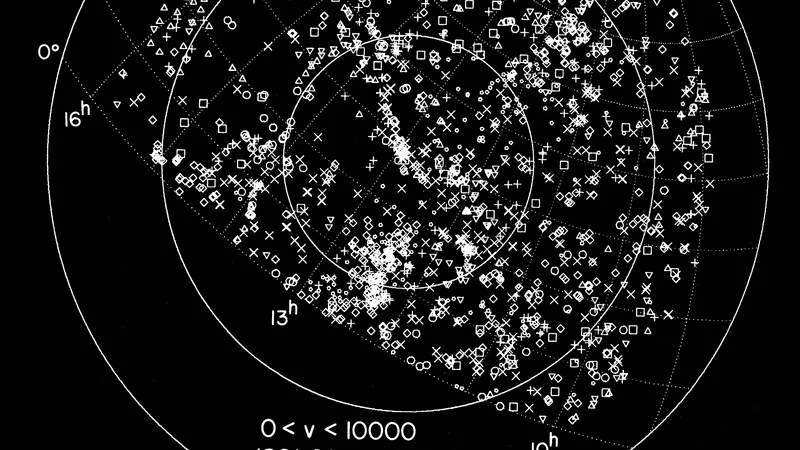
Image: von Hoerner 1960, Z. Astrophys. 50, 184, Abb. 3: density distribution that the 16-star cluster settles into (computed result averaged over relaxation times 2 to 10) compared with the initial distribution, an isothermal polytrope and r^-4 (journal p. 210) (tones inverted)
Particles
16
Machine
Siemens 2002
Sebastian von Hoerner was the first to publish star clusters played out on an electronic computer, with every star pulling on every other. His Siemens 2002 in Heidelberg managed about 2000 calculations a second, so his largest cluster held just 16 stars. Every simulation in this gallery grows from the same loop: work out the pulls, nudge each body forward a little, repeat.
Sebastian von Hoerner integrated small star clusters directly on an electronic computer in Heidelberg, the first published computer N-body simulations.
His largest 1960 cluster had just 16 stars, run on a Siemens 2002 managing about 2000 floating-point operations per second.
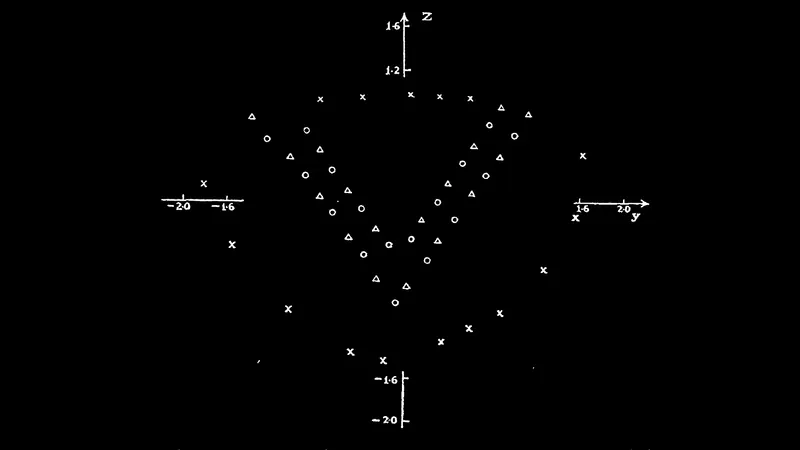
Image: Aarseth 1963, MNRAS 126, 223, Fig. 5: initial distribution in the yz-plane of the V-shaped 50-body cluster with halo (journal p. 242) (tones inverted)
Particles
100
Sverre Aarseth used a computer to follow swarms of 25 to 100 galaxies bound together by their own gravity, the way real galaxy clusters are. When two bodies came very close, Newton's law sent the forces soaring and the calculation broke down, so he softened gravity slightly at short range. That small trick was inherited by nearly every gravity code that followed.
Sverre Aarseth followed clusters of 25 to 100 galaxies on a fast computer, using slightly softened Newtonian forces so close encounters stayed tractable.
He slightly modified Newton's law so close collisions converged, the softening trick that nearly every later gravity code inherited.
Image: Peebles 1970, AJ 75, 13, Fig. 1(a,b): Model 1 particle positions at t = 2.8 and 5.6 billion years (journal p. 14) (tones inverted)
Particles
300
The Coma Cluster is a vast swarm of galaxies. Jim Peebles asked whether gravity alone could gather such a swarm out of a slightly denser patch of the expanding universe, and tested the idea on a computer with 300 equal galaxies. It was one of the earliest direct checks that small lumps in the young universe could grow into the structures we see.
Jim Peebles modelled the Coma Cluster as a collapsing protocluster of 300 equal-mass galaxies, an early direct N-body test of gravitational instability in cosmology.
The standard model had N = 300 galaxies, while Coma itself holds about 800 galaxies brighter than the paper's magnitude limit.
Image: Alar and Juri Toomre (1972), as reproduced on the page (tones inverted)
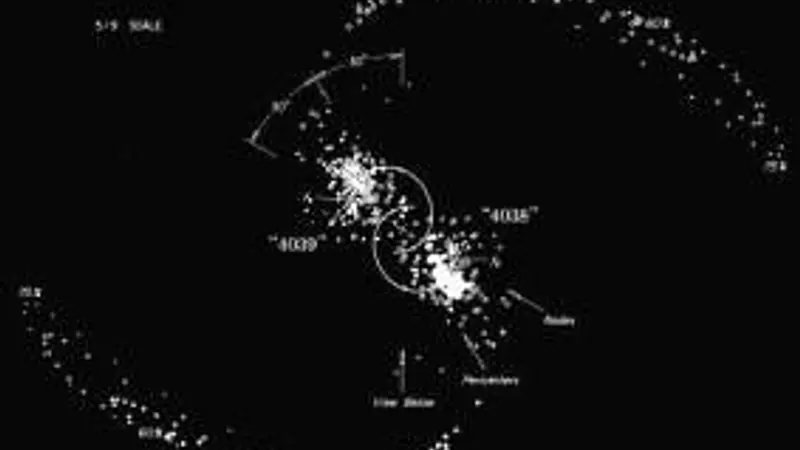
Some pairs of galaxies trail long streamers of stars or are linked by thin bridges. Alar and Juri Toomre showed these are the marks of a close fly-by: as two galaxies swing past each other, each one's gravity drags out the other's outer stars. Using gravity alone, their computer models reproduced four real pairs, among them the Whirlpool Galaxy and the Antennae.
Alar and Juri Toomre showed with test-particle disks that the bridges and tails of interacting galaxies are tidal relics of close encounters.
They reconstructed four real pairs, including M51 with NGC 5195 and the Antennae (NGC 4038/9), using gravity alone.
Simulates
galaxies
Method
N-body
Led by
Alar Toomre, Juri Toomre
Institutions
MIT, New York University, Goddard Institute for Space Studies
Image: Press & Schechter 1974, ApJ 187, 425, Fig. 1a: mass spectrum of condensed clusters in N-body Experiment A (1000 bodies, uncorrelated) at expansion factors R = 1.0 to 10.0 (journal p. 432) (tones inverted)
Particles
1,000
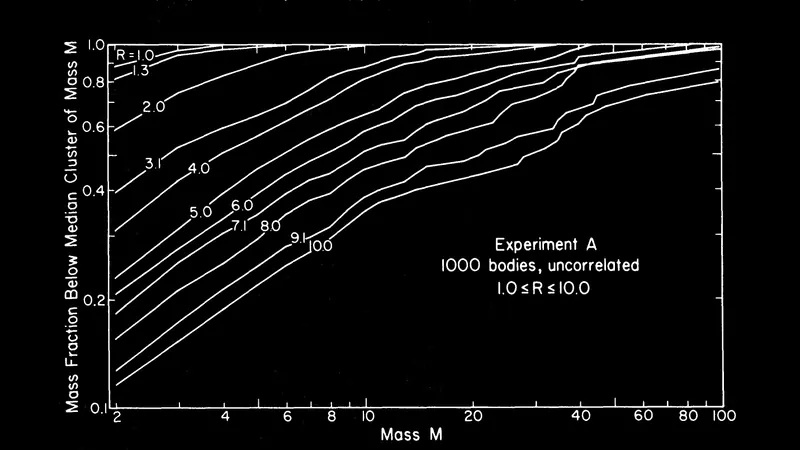
William Press and Paul Schechter worked out, mostly on paper, how many lumps of each mass should form as an expanding universe clumps under gravity: many small ones, fewer large ones. They checked their formula against a computer experiment with 1000 bodies. It proved remarkably durable, still serving as the yardstick for simulations a million times larger in 2001.
Press and Schechter proposed the mass spectrum of collapsed objects in an expanding universe and checked it with 1000-body numerical experiments.
Their analytic mass function, tested on just 1000 bodies, was still the benchmark for the billion-particle Hubble Volume mass function in 2001.
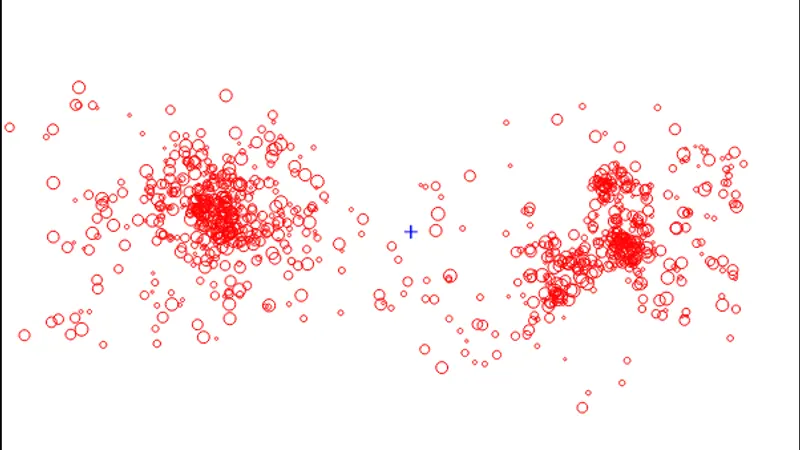
Image: White 1976, MNRAS 177, 717, Fig. 1(a): projected distribution of particles in the model cluster at t = 0 (journal p. 721) (tones inverted)
Particles
700
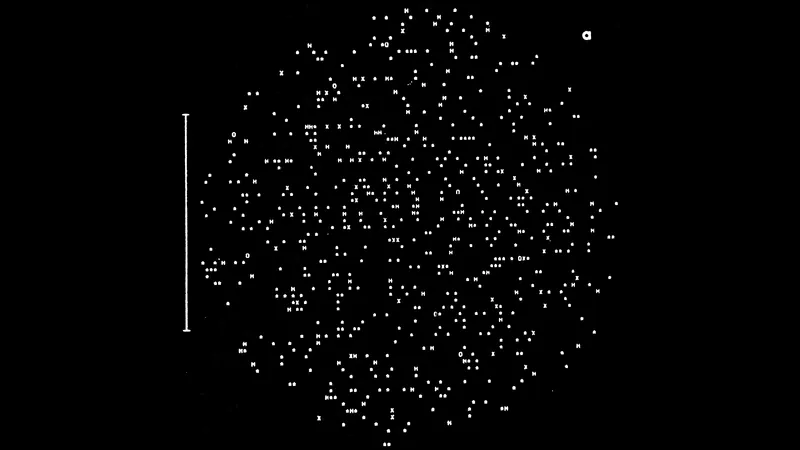
Simon White built a model galaxy cluster out of 700 bodies and watched how it came together. It did not collapse in one go: smaller groups formed first, then merged into the big cluster. The end result resembled the real Coma Cluster closely enough that he could weigh it, at about 2.4 million billion times the mass of the Sun.
Simon White integrated a 700-body model of a rich galaxy cluster, showing clusters grow by amalgamating smaller subclusters.
The final state fitted the Coma cluster and gave it a dynamical mass of 2.4 × 10^15 solar masses.
Image: Lucy 1977, AJ 82, 1013 (the other founding SPH paper of 1977), Fig. 4(a-d): evolution of a rotating protostar, SPH particles projected on the equatorial plane (journal p. 1022). Gingold & Monaghan 1977 shows only line and surface plots (tones inverted)
Particles
80
Method
SPH
Gas is hard to compute because it flows, swirls and squeezes. In 1977 Gingold and Monaghan, and Lucy working on his own, hit on the same idea: break the gas into particles, each carrying a soft smudge of density and temperature that blends with its neighbours. Smoothed particle hydrodynamics was first tried on single stars, and later became the gas engine of many simulated universes.
Gingold and Monaghan, and independently Lucy, replaced fluid grids with particles carrying smoothed properties, creating SPH, later the gas engine of many cosmological codes.
Gingold and Monaghan's first test used roughly 80 particles in three dimensions to model rotating and magnetic polytropic stars.
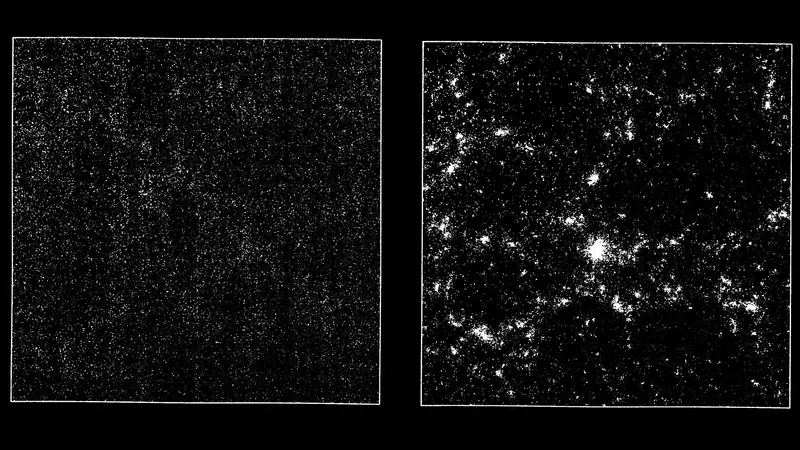
Image: Efstathiou & Eastwood 1981, MNRAS 194, 503, Fig. 1: X-Y projection of the particle positions in a 20 000-body experiment after expansion by a factor 9.9 (Einstein-de Sitter) (journal p. 511) (tones inverted)
Particles
20,000
George Efstathiou and J. W. Eastwood scattered 1000, then 20,000 particles through a model expanding universe and let gravity draw them together. They measured how strongly the particles bunched and how fast neighbours moved relative to each other, numbers astronomers could compare with real galaxies. The larger runs disagreed with a pen-and-paper prediction by Davis and Peebles about how clusters settle.
Efstathiou and Eastwood followed particle clustering in Friedmann universes with 1000- and 20,000-body simulations, measuring correlation functions and pair velocities.
The 20,000-body runs found no previrialization of clusters, contradicting the kinetic theory calculations of Davis and Peebles.
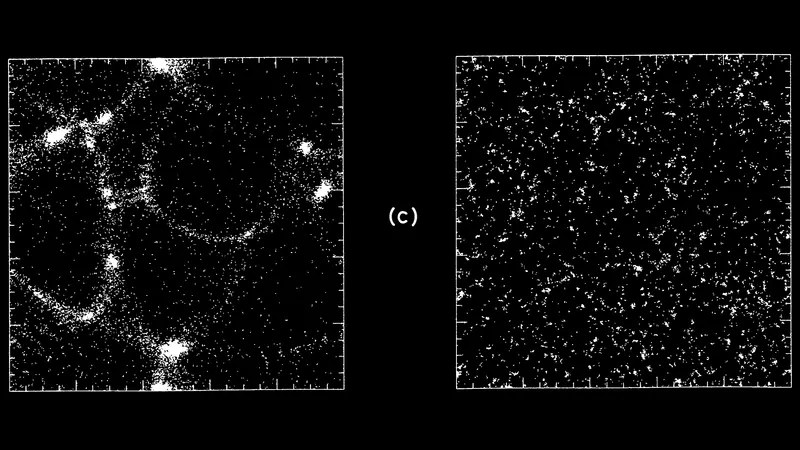
Image: Efstathiou, Davis, Frenk & White 1985, ApJS 57, 241, Fig. 5(c): final particle positions of the "pancake" (left) and "Poisson" (right) models computed with the high-resolution P3M code (journal p. 252) (tones inverted)
Method
P3M
A way to compute gravity among many particles both quickly and accurately. Hockney and Eastwood split the job in two: the gentle pull of distant matter is smoothed over a grid, which computers handle fast, while close neighbours are added up pair by pair. Through the 1980s this method, P3M, did the heavy lifting in most computer models of how cosmic structure grew.
Hockney and Eastwood's P3M scheme splits gravity into a fast mesh part and a direct short-range sum, the workhorse of 1980s cosmological N-body codes.
Efstathiou, Davis, Frenk and White (1985) concluded P3M, not plain particle-mesh, was needed to follow clustering in cold dark matter.
Image: Klypin & Shandarin 1983, MNRAS 204, 891, Fig. 2(b): particle distribution at expansion factor 13.6, clusters linked by filaments around large voids (journal p. 898) (tones inverted)
Box
160 Mpc/h
Particles
32,768
Working in the Soviet Union, Anatoly Klypin and Sergei Shandarin ran the first fully three-dimensional computer models of the universe's large-scale structure: 32,768 particles in a cube about 750 million light-years across. Gravity first squeezed matter into thin sheets, nicknamed pancakes, which then broke up into a network of filaments and clumps, the same kind of web later seen in galaxy maps.
Klypin and Shandarin ran the first fully three-dimensional simulations of large-scale structure, showing pancakes evolve into a network of filaments and clumps.
The whole universe model held 32^3 = 32,768 particles on a 32^3 mesh in a cube about 160 Mpc/h across.
Image: Davis, Efstathiou, Frenk & White 1985, ApJ 292, 371, Fig. 1 (top row): particle projections of Einstein-de Sitter CDM run EdS1, initial conditions (left) and after expansion by a = 4.5 (right) (journal p. 374) (tones inverted)
Particles
32,768
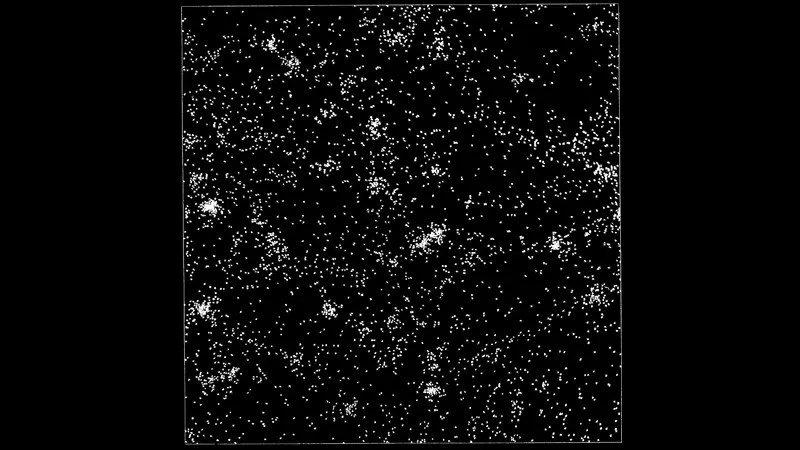
Marc Davis, George Efstathiou, Carlos Frenk and Simon White, nicknamed the Gang of Four, put a new idea to the test: that most of the universe's mass is cold dark matter, invisible stuff whose particles move slowly and clump easily. With 32,768 particles per run they grew filaments and empty voids. Matching real galaxy maps took one more insight: galaxies may form only in the densest spots, so they need not trace all the mass.
The 'Gang of Four' simulated structure growth in a cold dark matter universe, showing filaments and voids and that galaxies may be biased tracers of mass.
Each run used 32,768 particles, and the Omega = 1 models only matched observations if galaxies formed at high density peaks.
Simulates
dark matter, large-scale structure
Method
N-body, P3M
Code
P3M
Particles
32,768
Led by
Marc Davis, George Efstathiou, Carlos S. Frenk, Simon D. M. White
Institutions
UC Santa Barbara ITP, UC Berkeley, Institute of Astronomy, Cambridge, University of Sussex, Steward Observatory
Computing gravity the obvious way means every particle pulling on every other, so doubling the particles quadruples the work. Josh Barnes and Piet Hut sorted space into nested boxes and let each distant group act as a single body, much as a far-off city looks like one point of light from a plane. The saving made far larger simulations affordable, and tree codes built on it are still in use.
Barnes and Hut grouped distant particles in an octree and treated each group as one body, cutting gravity cost from N squared to N log N.
Treating distant groups as single bodies cut the cost of gravity from order N squared to order N log N.
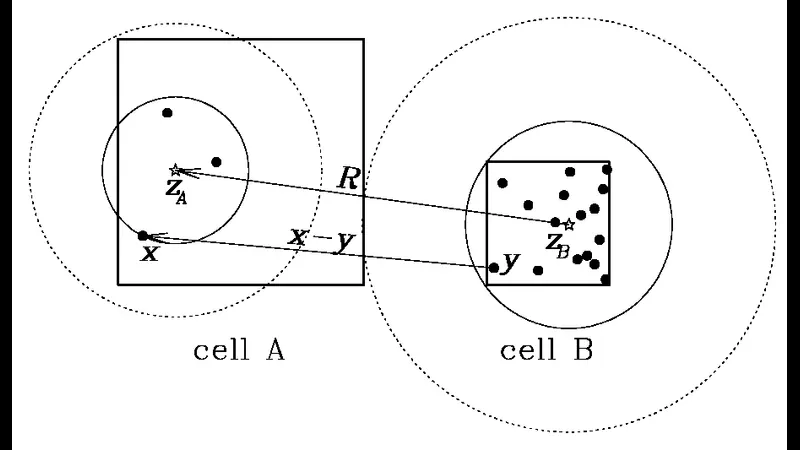
Image: Dehnen 2002, J. Comput. Phys. 179, 27, arXiv:astro-ph/0202512, Fig. 1: two interacting cells of bodies (dots) with their centres of mass, the cell-cell interaction at the heart of the fast multipole method (Greengard & Rokhlin 1987 is not available as a freely accessible scan)
Method
FMM
Leslie Greengard and Vladimir Rokhlin found a mathematical shortcut for any problem where many particles push or pull on each other across a distance. Rather than tallying every pair, the fast multipole method sums up distant crowds with a few numbers, so the cost grows only in step with the number of particles while the error stays under control. It has been called one of the top ten algorithms of the twentieth century.
Greengard and Rokhlin's fast multipole method computes long-range particle interactions with controlled error at cost growing only linearly with N.
The FMM has been called one of the top ten algorithms of the twentieth century.
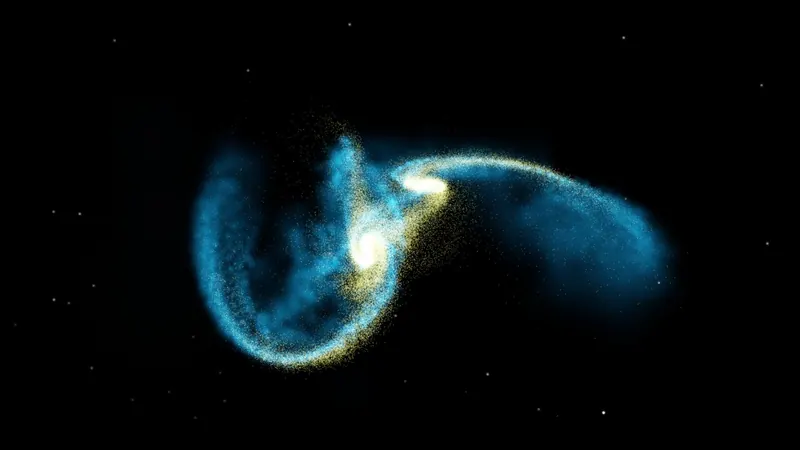
Image: Frank Summers (STScI), Chris Mihos (CWRU), Lars Hernquist (Harvard); visualisation of a Mihos & Hernquist galaxy-merger simulation (STScI 2002-09); their merger runs used TREESPH (Mihos & Hernquist 1996, arXiv:astro-ph/9512099)
Method
tree, SPH
Lars Hernquist and Neal Katz joined two recent inventions in one program: the tree method for gravity and smoothed particles for gas. With no fixed grid, TREESPH concentrates its effort wherever matter gathers, and takes small time steps only where things change quickly. That made it practical to simulate large numbers of gas and dark matter particles together.
Hernquist and Katz joined SPH gas with the hierarchical tree for gravity, producing a fully Lagrangian, gridless code adaptive in space and time.
Costs per step scaled as N for SPH and N log N for the tree, making large-N gas simulations feasible.
Simulates
gas, dark matter, stars
Method
tree, SPH
Led by
Lars Hernquist, Neal Katz
Institutions
Institute for Advanced Study, Princeton University Observatory
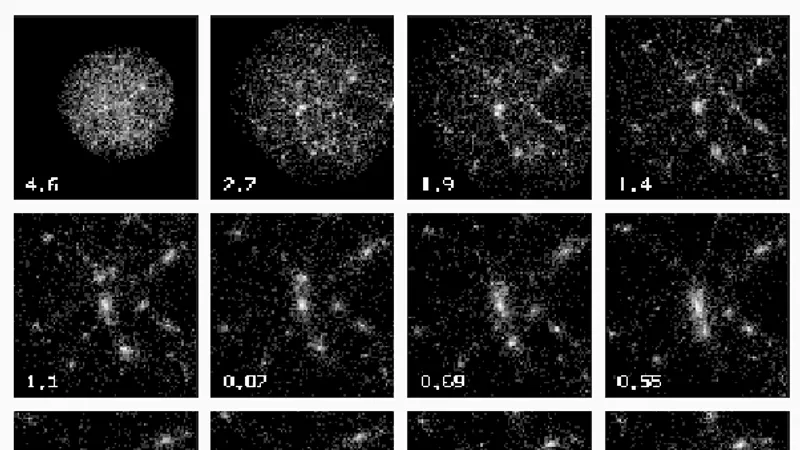
Image: Run made on GRAPE-5: Fukushige & Makino 2001, ApJ 557, 533, arXiv:astro-ph/0008104, Fig. 1: snapshots of CDM halo run 16M0 at 16 redshifts
Method
N-body
Instead of writing faster software, a team at the University of Tokyo built faster hardware. GRAPE boards (short for GRAvity PipE) carried chips made to do one thing, compute the gravitational pulls between particles, and plugged into an ordinary workstation they sped up its simulations enormously. Later versions won Gordon Bell prizes for high-performance computing in 1999, 2000 and 2001.
The University of Tokyo's GRAPE (GRAvity PipE) boards hard-wired the gravitational force calculation, accelerating N-body codes on ordinary workstations.
GRAPE-5 won the Gordon Bell price-performance prize in 1999 and GRAPE-6 won prizes in 2000 and 2001.
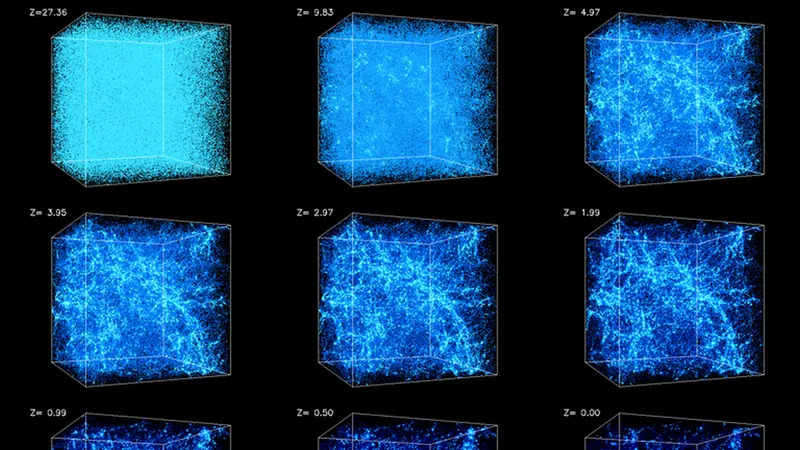
Image: Virgo Consortium LambdaCDM simulation at z=0 (Hydra AP3M code; Jenkins et al. 1998, ApJ 499, 20); picture by Joerg Colberg
Method
P3M
The grid-plus-neighbours way of computing gravity (P3M) slows to a crawl once matter clumps, because dense regions hold too many close pairs to add up. Hugh Couchman's fix was to lay finer grids over the crowded spots, making the code 10 to 20 times faster under heavy clustering. It became the basis of Hydra, the Virgo Consortium's simulation code.
Hugh Couchman added refined meshes in dense regions to P3M, removing its slowdown under heavy clustering; the basis of the Virgo Consortium's Hydra code.
Under heavy clustering it ran 10 to 20 times faster than conventional P3M and about 50% faster than a tree code.
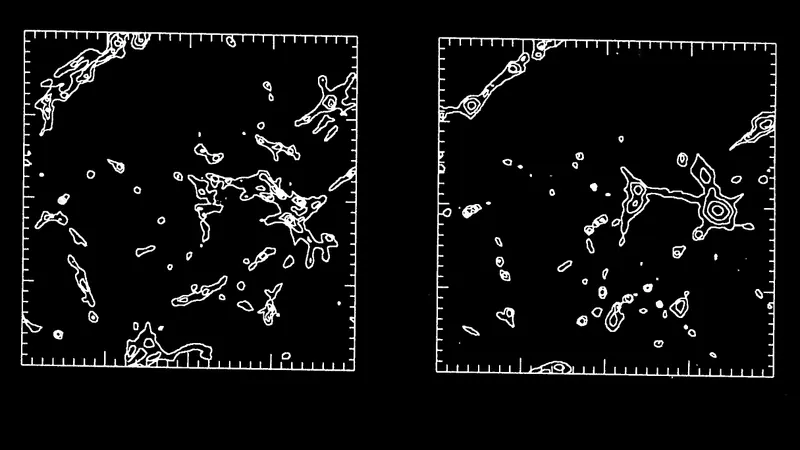
Image: Cen & Ostriker 1992, ApJ 393, 22 (companion paper describing the same CDM hydrodynamic simulation as ApJ 399, L113), Fig. 5 (top row): contour maps of baryonic matter density in thin slices of the box (journal p. 30; figure rotated to reading orientation) (tones inverted)
Box
80 Mpc/h
Particles
8.0 × 10⁶
Renyue Cen and Jeremiah Ostriker put ordinary gas alongside dark matter in a computer universe about 370 million light-years across, with rough rules for turning dense, cooling gas into galaxies. Their question: do galaxies sit where the mass is, or do they bunch together more tightly? The answer was a bias of about 1.6, meaning galaxies clustered noticeably more strongly than the invisible matter around them.
Cen and Ostriker added heuristic galaxy formation to a cosmological Eulerian hydro plus PM dark matter code, measuring how galaxies are biased relative to dark matter.
Their CDM run had 8 million cells and 8 million dark matter particles in an 80 Mpc/h box, giving a bias of about 1.6.
Image: J. Shalf, Y. Zhang (UIUC) et al., Grand Challenge Cosmology Consortium (GC3); simulated Lyman-alpha forest gas at z=3 (NASA APOD 2000-11-12)
Simulating how galaxies form needed astrophysicists and computer scientists working side by side, and in 1993 the US National Science Foundation paid for exactly that. Led by Jeremiah Ostriker, the Grand Challenge Cosmology Consortium wrote programs able to split the work across many processors at once, then compared them against each other. The grant ran until November 1998 and came to about 3.4 million dollars.
An NSF-funded US collaboration of astrophysicists and computer scientists that developed and compared parallel codes for simulating galaxy and structure formation.
The NSF award, led by Jeremiah Ostriker, totalled $3,422,091 for September 1993 to November 1998.
Simulates
dark matter, gas, galaxies, large-scale structure
Method
N-body, AMR, SPH
Led by
Jeremiah Ostriker, Edmund Bertschinger, Michael Norman, Lars Hernquist
Institutions
Princeton University, MIT, UC Santa Cruz, University of Illinois, NCSA, Pittsburgh Supercomputing Center, Indiana University
Image: Springel et al. 2005, arXiv:astro-ph/0504097, Fig. 1
An alliance of astrophysicists from Britain, Germany, Canada and the United States, founded in 1994, behind several of the best-known computer universes in this gallery. Its work includes the Millennium Simulation, the Aquarius haloes, which zoom in on the dark matter clouds around virtual Milky Ways, and the Phoenix haloes, which do the same for giant galaxy clusters.
International collaboration, founded in 1994, of British, German, Canadian and US astrophysicists behind the Millennium runs, the Aquarius Milky Way haloes and the Phoenix cluster haloes.
The Millennium paper describes the Virgo Consortium as a collaboration of British, German, Canadian and US astrophysicists.
Simulates
dark matter, large-scale structure, Milky Way analogues, clusters
Method
N-body, TreePM
Code
GADGET
Led by
Volker Springel, Simon D. M. White, Carlos S. Frenk, Adrian Jenkins
Image: Virgo Consortium (caption: Hydra gas particles)
Particles
65,536
Method
P3M, SPH
Machine
Sun SPARCstation
The Virgo Consortium's workhorse program of the 1990s, Hydra paired fast gravity on adaptive grids with smoothed particles for gas, so dark matter and ordinary gas could evolve side by side. It was frugal enough that a test with 65,536 particles, half of them gas, ran 1000 steps in a single day on an ordinary Sun workstation.
Hydra combined adaptive P3M gravity with SPH gas, the Virgo Consortium code behind its 1990s simulations.
A 1000-step run with 65,536 particles, half dark and half gas, took one day on a Sun Sparc10 workstation.
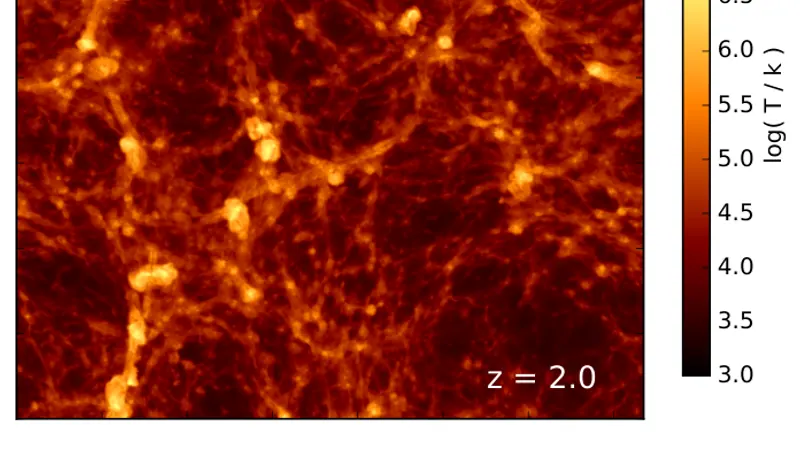
Image: Neal Katz, Lars Hernquist & David Weinberg: gas particles at z=2 colour-coded by temperature, standard-CDM TreeSPH simulation described in KWH 1996 (image made with TIPSY)
Neal Katz, David Weinberg and Lars Hernquist taught their TreeSPH code to work inside an expanding universe, then let its gas cool, feel the ultraviolet glow of the cosmos, and form stars that explode as supernovae. Galaxy-sized clumps of gas condensed within the dark matter. Curiously, much the same galaxies appeared whether the star-forming rules were switched on or not.
TreeSPH was extended to comoving coordinates with cooling, a UV background and star formation with supernova feedback, forming galaxy-mass clumps in CDM volumes.
The galaxy population came out nearly the same with or without the star formation recipe.
Image: Navarro, Frenk & White 1997, arXiv:astro-ph/9611107, Fig. 1 (particle plots of halo assembly in the same NFW N-body halo series; companion paper to NFW 1996)
Julio Navarro, Carlos Frenk and Simon White zoomed in on the clouds of dark matter, called haloes, that surround everything from dwarf galaxies to great clusters. Whatever the size, the clouds had the same shape: densest at the centre, thinning gently at first and then more steeply towards the edge. That universal profile, named NFW after its authors, became a standard way to describe dark matter haloes.
Navarro, Frenk and White resimulated halos from dwarf to cluster masses and found one universal density profile, now called NFW.
Halos are shallower than r^-2 at the centre and steeper near the virial radius, whatever their mass or cosmology.
Simulates
dark matter
Method
N-body
Led by
Julio F. Navarro, Carlos S. Frenk, Simon D. M. White
Image: Andrey Kravtsov (University of Chicago) and Anatoly Klypin (New Mexico State University); ART simulation run at NCSA
Method
N-body, PM, AMR
A gravity program that behaves like a zoom lens: it lays a coarse grid over the whole universe, then keeps splitting cells into finer ones wherever matter gets dense. Andrey Kravtsov, Anatoly Klypin and Alexei Khokhlov used it to show that dark matter piles up in sharp peaks at the centres of haloes, too sharp, it seemed, to match how small spiral galaxies rotate.
N-body code that refines a particle-mesh grid recursively where density is high, an early adaptive-mesh approach later echoed in RAMSES.
Its first science found LCDM halo cusps matching the Navarro-Frenk-White profile, too cuspy to explain dwarf spiral rotation curves.
Simulates
dark matter
Method
N-body, PM, AMR
Led by
Andrey V. Kravtsov, Anatoly A. Klypin, Alexei M. Khokhlov
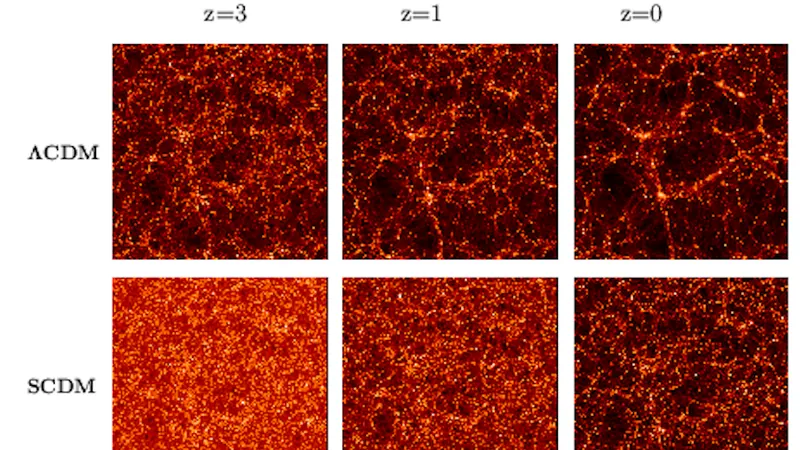
Image: Virgo Consortium (projected mass in slices at three redshifts for each model)
Box
239.5 Mpc/h
Particles
1.7 × 10⁷
Machine
Cray T3D
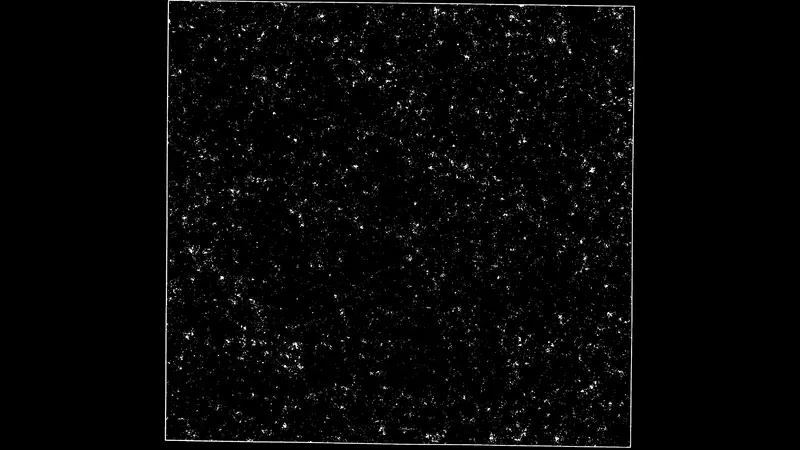
Four computer universes, each with nearly 17 million particles in a cube about 1.1 billion light-years across, run by the Virgo Consortium on Cray supercomputers in Edinburgh and Garching. Each tried a different recipe for cold dark matter. Set against real galaxy maps, they showed galaxies cannot simply follow the mass: how strongly they cluster compared with dark matter changes with scale.
The Virgo Consortium, founded in 1994, ran four 17-million-particle CDM universes, showing galaxies must be biased relative to mass in a scale-dependent way.
The runs used 128 or 256 processors of Cray T3Ds in Edinburgh and Garching, with code written in CRAFT Fortran.
Simulates
dark matter, large-scale structure
Method
P3M
Code
Hydra (parallel AP3M)
Box
239.5 Mpc/h on a side
Particles
16.7 million
Runs to
today (redshift 0)
Supercomputer
Cray T3D (EPCC Edinburgh; Rechenzentrum Garching)
Led by
Adrian Jenkins, Carlos S. Frenk, Simon D. M. White
Institutions
Edinburgh Parallel Computing Centre, Rechenzentrum Garching
Image: Klypin, Kravtsov, Valenzuela & Prada 1999, ApJ 522, 82, arXiv:astro-ph/9901240, Fig. 2: dark matter particles within 1.5 Mpc/h of a Local-Group-like pair of halos in the LCDM simulation, with their satellites (rendered from the arXiv source file fig2_lr.ps)
Box
7.5 Mpc/h
Particles
2.1 × 10⁶
Anatoly Klypin's group zoomed into small patches of a computer universe, at most about 35 million light-years across, to count the dark matter clumps around a galaxy like the Milky Way. They found about 50, where astronomers knew of roughly a dozen small companion galaxies. The gap was named the missing satellites problem.
High-resolution ART simulations predicted about 50 dark satellites around a Milky Way-sized halo, against roughly a dozen observed: the missing satellites problem.
The two runs used 128^3 particles in boxes only 7.5 and 2.5 Mpc/h across.
Simulates
dark matter, dwarf galaxies, Milky Way analogues
Method
AMR, N-body
Code
ART
Box
7.5 Mpc/h on a side
Particles
1283 (≈2.1×10⁶)
Mass resolution
1.66×10⁷ M☉/h (ΛCDM); 2.05×10⁶ M☉/h (SCDM)
Supercomputer
NCSA
Led by
Anatoly Klypin, Andrey Kravtsov, Octavio Valenzuela, Francisco Prada
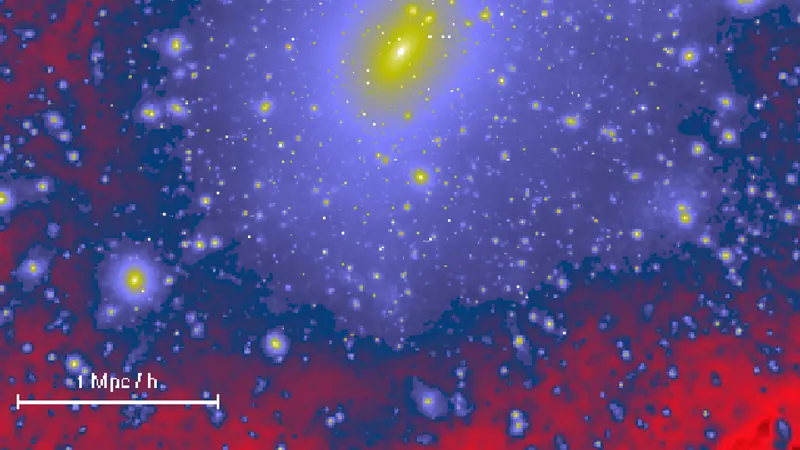
Image: Moore et al. 1999, arXiv:astro-ph/9907411, Fig. 1
Particles
1.0 × 10⁶
Ben Moore's team simulated the dark matter cloud around a galaxy like ours with more than a million particles, sharp enough to see what survives inside it. It looked like a miniature galaxy cluster, crowded with smaller dark clumps. If each clump held a small galaxy, the Milky Way should have about 500 companions larger than its little satellites Draco and Ursa Minor, far more than astronomers see.
Million-particle halos showed galaxy halos are scaled-down clusters full of surviving dark subhalos, predicting far more satellites than the Milky Way has.
The model predicted about 500 Milky Way satellites larger than Draco and Ursa Minor.
Simulates
dark matter, Milky Way analogues, dwarf galaxies
Method
tree
Code
PKDGRAV
Particles
>1 million per halo within the virial radius
Runs to
today (redshift 0)
Led by
Ben Moore, Sebastiano Ghigna, Fabio Governato, George Lake, Thomas Quinn, Joachim Stadel, Paolo Tozzi
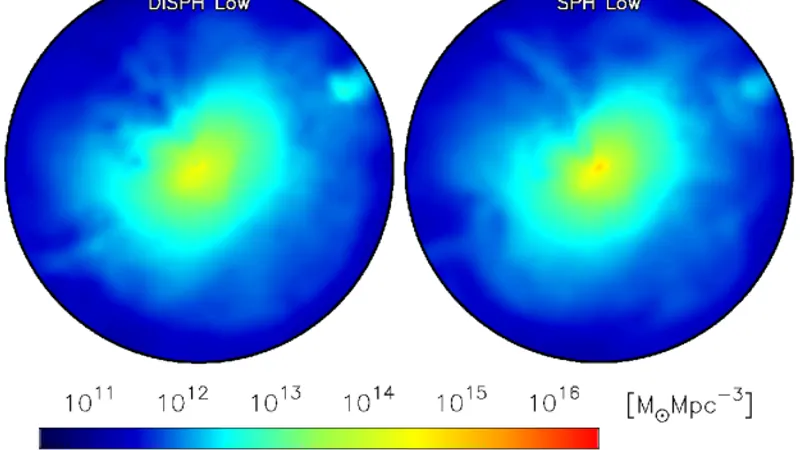
Image: Saitoh 2016, arXiv:1604.04868, Fig. 1: gas density maps at z=0 of the Santa Barbara cluster (re-simulated from the Santa Barbara comparison initial conditions with DISPH and SPH)
Twelve different simulation codes were handed the same starting point and asked to build the same galaxy cluster. If computer models of cosmic gas could be trusted, their answers should agree. Gas temperatures and amounts matched to about ten percent, but the cluster's X-ray brightness differed by up to a factor of two, a warning that some results depended on the method.
Twelve codes, SPH and grid alike, simulated the same non-radiative X-ray cluster to test how reliable cosmological gas simulations were.
Temperatures and gas fractions agreed to about 10%, but X-ray luminosities differed by up to a factor of two.
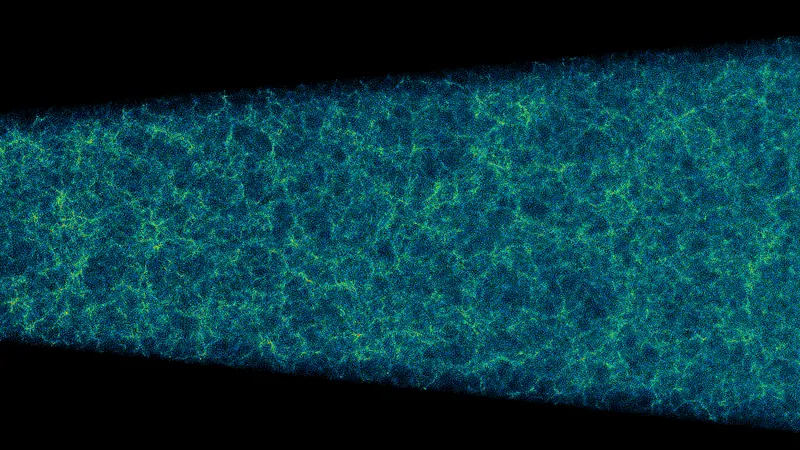
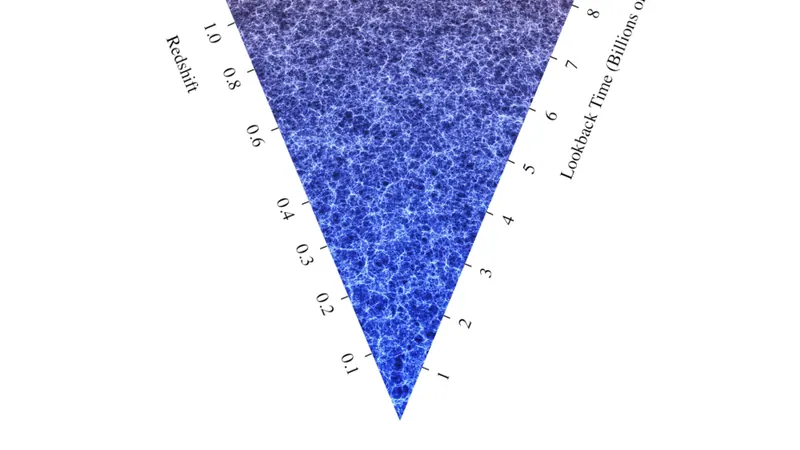
Image: Virgo Consortium (deep wedge of ΛCDM simulation)
Box
3,000 Mpc/h
Particles
1.0 × 10⁹
Machine
Cray T3E
Two computer universes so large they take in a big share of everything we could ever observe, each made of a billion particles. The larger cube measured about 14 billion light-years across, and its run took about 70 hours on a Cray supercomputer in Garching, producing almost a terabyte. Astronomers used them to build fake sky surveys and count galaxy clusters as real telescopes would see them.
Two billion-particle Virgo Consortium runs covered a large fraction of the observable universe, giving mock sky surveys and cluster counts along the light-cone.
Each run used 10^9 particles; the ΛCDM cube was 3 Gpc/h across and produced almost a terabyte in about 70 hours.
Simulates
dark matter, clusters, large-scale structure
Method
N-body
Box
3,000 Mpc/h on a side
Particles
109 per run (ΛCDM 3000 Mpc/h; τCDM 2000 Mpc/h)
Supercomputer
512-processor Cray T3E, Garching
Led by
J. M. Colberg, A. E. Evrard, A. Jenkins, C. S. Frenk, S. D. M. White, H. M. P. Couchman
Image: Dark matter in the S4 cluster run with GADGET: Springel, White, Tormen & Kauffmann 2001, MNRAS 328, 726, arXiv:astro-ph/0012055, Fig. 2
Method
N-body, tree, SPH
GADGET is a public program that computes how millions of particles pull on each other and, if asked, how gas flows between them. Volker Springel, Naoki Yoshida and Simon White released it in 2001, in versions for a single computer and for large parallel machines, so any group could simulate growing cosmic structure or colliding galaxies. Its successors ran the Millennium Simulation and many others in this gallery.
The first public GADGET: a tree N-body code with smoothed particle hydrodynamics for gas, released in serial and massively parallel versions for cosmology and galaxy collisions.
The serial version could swap its tree for GRAPE, special-purpose gravity hardware; runs had reached 7.5×10^7 particles by 2000.
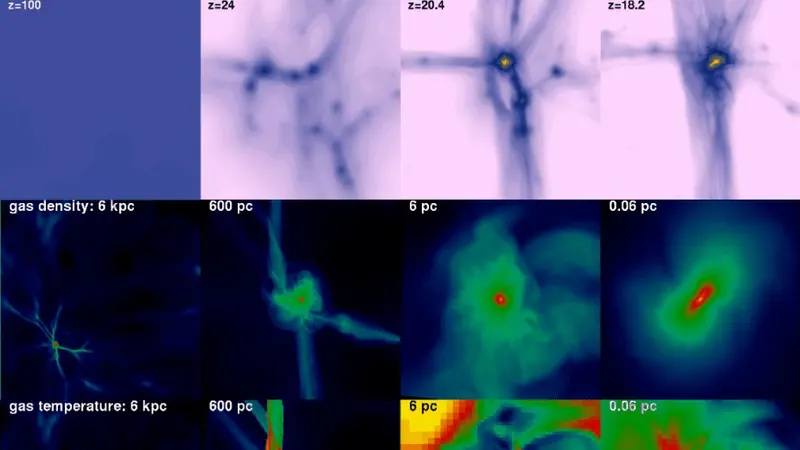
Image: Abel et al. 2001, arXiv:astro-ph/0112088, Fig. 1
Machine
Blue Horizon
The universe's first stars were made from the raw hydrogen and helium left by the Big Bang. Tom Abel, Greg Bryan and Michael Norman followed such gas as it fell into a small clump of dark matter, zooming in on the collapse in three dimensions with a code able to magnify a million million times. What began to form was a single massive star, suggesting the earliest stars were born big and alone.
A fully three-dimensional hydrodynamic simulation followed primordial gas collapsing in a dark matter minihalo into a single massive first star.
The companion Enzo run reached 34 levels of refinement over 8000 subgrids, a 10^12 refinement factor needing 128-bit arithmetic.
Simulates
dark matter, gas, first stars
Method
AMR
Code
Enzo
Supercomputer
IBM SP2 Blue Horizon, San Diego Supercomputer Center
Image: Teyssier 2002, A&A 385, 337, arXiv:astro-ph/0111367, Fig. 12 (top two rows): dark matter density and X-ray emissivity of the 5 most massive halos in RAMSES run P256L5 (from the arXiv source file fig12.jpg)
Method
AMR, PM, N-body
Romain Teyssier's RAMSES lays a grid over the simulated universe and splits each cell into smaller ones wherever there is something worth seeing, like a map that gains detail only where it is needed. Gas is computed on this grid, while dark matter travels as particles. It later powered Horizon-AGN and other large simulations of how galaxies form.
Adaptive mesh refinement code that refines cell by cell on a tree, pairing an ART-like N-body solver with a second-order Godunov scheme for gas.
Used for Horizon-AGN; the 2002 test run reached a formal resolution of 8192^3 with only 256^3 particles.
Gasoline is a program for computing gas and gravity together, grown out of the PKDGRAV gravity code so its work can be spread over many processors at once. James Wadsley, Joachim Stadel and Thomas Quinn built it for galaxy formation. The same code has since been applied across a vast range of scales, from clusters of galaxies down to the birth of gas-giant planets like Jupiter.
Parallel TreeSPH code built as an extension of the PKDGRAV N-body code, used for galaxy clusters, galaxy formation and even gas-giant planets.
One code, applied from galaxy clusters down to the formation of gas-giant planets.
The second version of Volker Springel's GADGET handled gas more carefully and added a faster way to compute gravity over long distances. Released to everyone, it was for years the most widely used program for simulating the universe. It ran the Millennium Simulation, the first to follow more than ten billion particles of dark matter.
Massively parallel TreeSPH code with an entropy-conserving SPH and optional TreePM gravity; publicly released and for years the most widely used cosmological simulation code.
Used for the first cosmological N-body simulation with more than 10^10 dark matter particles, the Millennium Simulation.
Ten billion particles of dark matter in a cube about 2.3 billion light-years across, followed from the young universe to today. Astronomers then planted model galaxies in the clumps it built, using simple rules for how gas cools and stars form, and got a virtual universe to set beside real galaxy surveys. The run filled almost all the memory of a 512-processor supercomputer in Garching.
Ten-billion-particle dark matter run of a 500 Mpc/h box that, with semi-analytic galaxies grafted on, became a shared reference universe for galaxy survey work.
The run used almost all of the 1 TB of memory on 512 processors of an IBM p690 in Garching.
Simulates
dark matter, large-scale structure, galaxies
Method
N-body, TreePM, semi-analytic
Code
GADGET-2
Box
500 Mpc/h on a side
Particles
21603 (≈1.0078×10¹⁰)
Mass resolution
8.6×10⁸ M☉/h
Runs to
today (redshift 0)
Supercomputer
IBM p690, 512 processors, Computing Centre of the Max-Planck Society, Garching
Compute
≈350,000 processor hours (28 days wall-clock)
Led by
Volker Springel, Simon D. M. White, Adrian Jenkins, Carlos S. Frenk
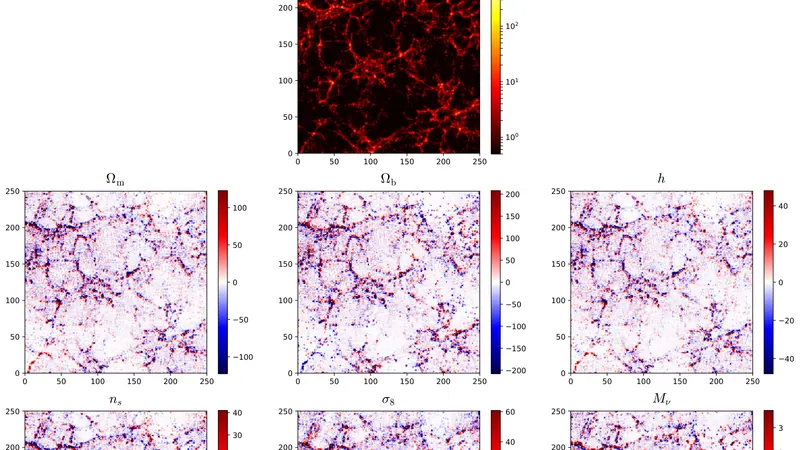
Image: Quijote simulations, large-scale structure and its parameter derivatives (initial conditions generated with the 2LPTic code): Villaescusa-Navarro et al. 2020, ApJS 250, 2, arXiv:1909.05273, Fig. 1
Method
N-body
Every simulation has to start from a snapshot of the young universe: almost smooth, with tiny ripples. 2LPTic, by Crocce, Pueblas and Scoccimarro, sets up that starting point more accurately, using a better mathematical estimate of how matter had already begun to move. With the older, cruder method the errors lingered: matter came out less clumpy than it should, by about 2 percent today and 8 percent when the universe was about two billion years old.
Initial-conditions generator using second-order Lagrangian perturbation theory, built from Springel's N-GenIC, to cut start-up transients left by the Zel'dovich approximation.
Zel'dovich starts at z=49 underestimate nonlinear power by about 2, 4 and 8 percent at z=0, 1 and 3, per the paper.
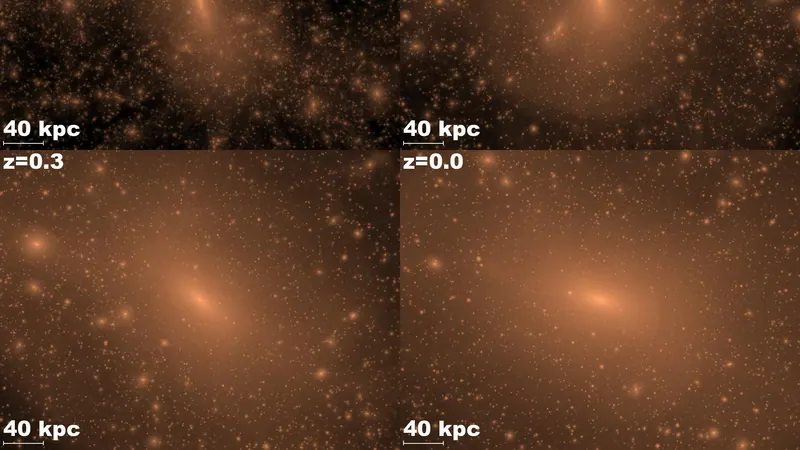
Image: not stated (Via Lactea project, J. Diemand et al.)
Particles
2.3 × 10⁸
Machine
Columbia
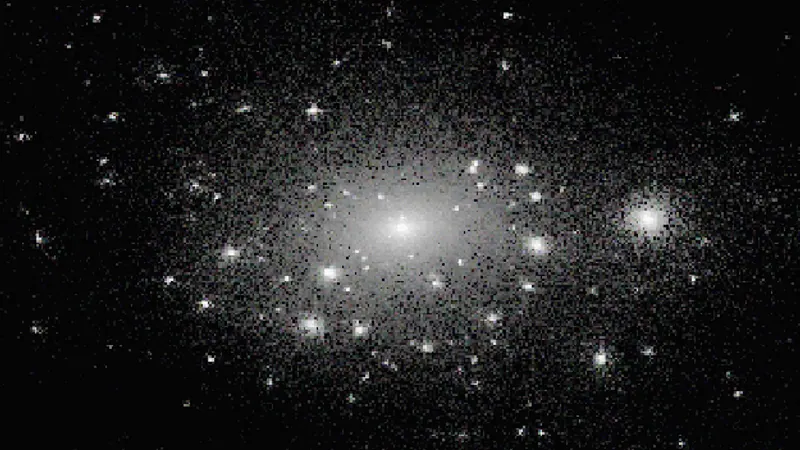
Jürg Diemand, Michael Kuhlen and Piero Madau spent 234 million particles on a single galaxy like ours, simulating only its invisible dark matter halo on NASA's Columbia supercomputer. At the time it gave the sharpest view of what lies inside such a halo: more than 10,000 smaller clumps survive to the present day, a few of them even near where the Sun sits.
A single Milky Way-size halo followed with 234 million particles, then the highest-resolution simulation of Galactic dark matter substructure.
Over 10,000 subhaloes are identified at redshift zero, with a few dark matter lumps resolved even near the Sun's position.
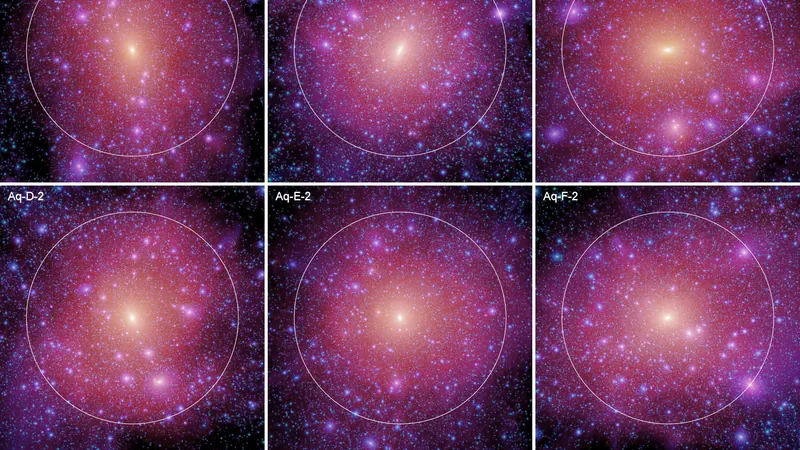
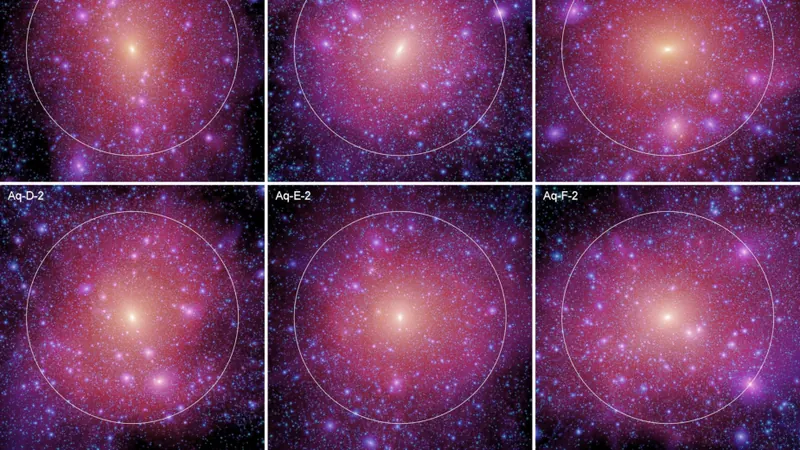
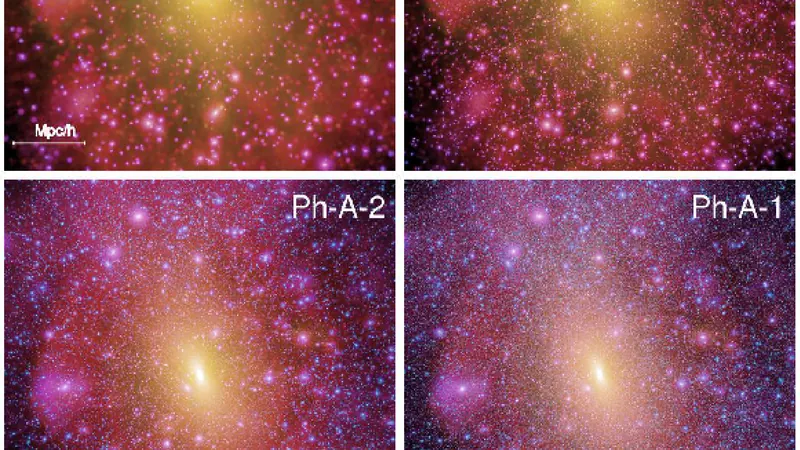
Six virtual Milky Ways, or rather the dark matter clouds around them, each simulated several times at rising detail to check that the answers held. The sharpest run spent over four billion particles on one halo and found nearly 300,000 smaller clumps inside it, with clumps nested in clumps four levels deep.
Six Milky Way-mass dark matter haloes resimulated at several resolutions, the top one resolving nearly 300,000 subhaloes and four generations of substructure.
In the largest run, Aq-A-1, nearly 300,000 bound subhaloes sit inside the halo's virialized region.
Simulates
dark matter, Milky Way analogues
Method
N-body, TreePM
Code
GADGET-3
Particles
Aq-A-1: 4,252,607,000 high-resolution particles (≈1.47 billion within r50)
Volker Springel's working sequel to GADGET-2, a program that computes how dark matter, gas and stars pull on and push against each other. It was never put up for download; instead copies passed from group to group, each adding its own rules for star birth and black holes. One heavily rebuilt version ran EAGLE, among the best-known computer universes of the 2010s.
Never publicly released successor of GADGET-2, passed between groups and heavily modified; it underlies several major galaxy-formation projects, including EAGLE.
EAGLE ran on a modified GADGET-3 whose main changes were the SPH formulation, time stepping and, most importantly, the subgrid physics.
Image: Dubois et al. 2014, arXiv:1402.1165, Fig. 1
Led from France, Horizon is a family of simulations that grow galaxies, complete with gas, stars and central black holes, inside a realistic slice of the cosmos, all computed with the RAMSES code. Its members run from Horizon-MareNostrum to NewHorizon and Extreme-Horizon. The flagship, Horizon-AGN, took 6 million hours of processor time on the Jade supercomputer in the south of France.
A French-led programme of RAMSES adaptive-mesh simulations of galaxy formation in a cosmic setting, including Horizon-MareNostrum, Horizon-AGN, NewHorizon and Extreme-Horizon.
Horizon-AGN, its flagship, ran for 6 million CPU hours on the Jade supercomputer in the south of France, according to the project site.
Simulates
dark matter, gas, stars, black holes, galaxies, large-scale structure
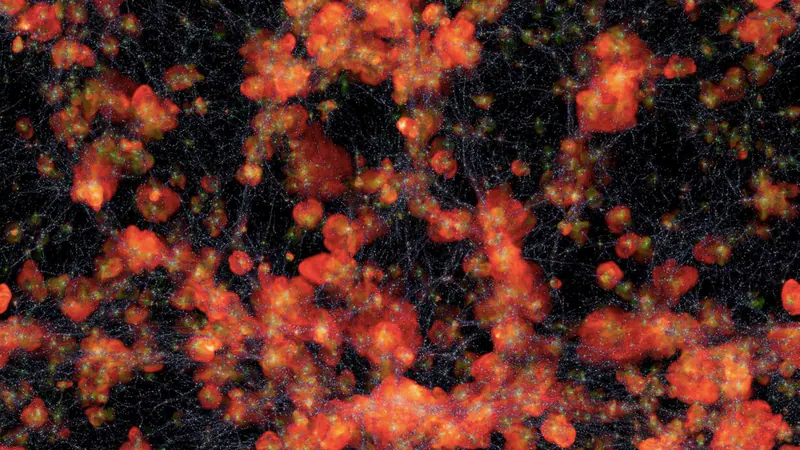
Image: C. Pichon & R. Teyssier, Horizon Project: composite image of the Horizon-MareNostrum simulation (red: dark matter, green: gas density, blue: temperature)
Box
50 Mpc/h
Particles
1.1 × 10⁹
Machine
MareNostrum
One of the early Horizon runs, computed on 2048 processors of the MareNostrum supercomputer in Barcelona. It grew galaxies in a cube about 230 million light-years across and caught them being fed by narrow streams of cold gas, flowing in along the cosmic web, roughly 10.5 to 12.7 billion years ago.
An early large adaptive-mesh galaxy-formation run that resolved cold gas streams feeding young galaxies between redshift 5.4 and 2.
It was run on 2048 processors of MareNostrum at the Barcelona Supercomputing Centre.
Simulates
dark matter, gas, stars, galaxies
Method
AMR
Code
RAMSES
Box
50 Mpc/h on a side
Particles
10243 dark matter particles
Mass resolution
DM about 8×10⁶ M☉
Supercomputer
MareNostrum, Barcelona Supercomputing Centre (2048 processors)
Image: not stated (Via Lactea project, J. Diemand et al.)
Particles
1.1 × 10⁹
Machine
Jaguar
A sequel to Via Lactea with nearly five times the particles: more than a billion, all spent on one dark matter halo the size of the Milky Way's. It resolved hundreds of dense clumps and streams of dark matter at the Sun's distance from the galactic centre. That matters to dark matter hunters: if the particles can destroy each other in flashes of gamma rays, the clumps would make the glow 4 to 15 times brighter.
A billion-particle Milky Way halo that resolved hundreds of dense dark matter clumps and cold streams near the solar circle.
Subhaloes boost predicted gamma-ray production from dark matter annihilation by factors of 4 to 15 over smooth models.
Simulates
dark matter, Milky Way analogues
Method
N-body, tree
Code
PKDGRAV2
Particles
1.1×10⁹ high-resolution particles
Mass resolution
4,100 M☉
Runs to
today (redshift 0)
Supercomputer
Jaguar Cray XT3, Oak Ridge National Laboratory
Compute
over a million processor hours
Led by
Jürg Diemand, Michael Kuhlen, Piero Madau, Marcel Zemp, Ben Moore, Doug Potter, Joachim Stadel
Image: Stadel et al. 2008, arXiv:0808.2981, Fig. 1
Particles
3.0 × 10⁹
Machine
MareNostrum
One dark matter cloud the size of the one wrapped around our Milky Way, followed with more than three billion particles. The team wanted to know how tightly the invisible matter packs into the very centre of a galaxy, and they could trace it to within about 390 light-years of the middle, a tiny fraction of the whole cloud.
A Galactic-mass dark matter halo simulated with over three billion particles to measure the inner density profile down to 120 parsecs.
The density profile is measured to 120 pc, just 0.05 per cent of the virial radius, where the log slope is -0.8.
Simulates
dark matter, Milky Way analogues
Method
N-body, FMM
Code
PKDGRAV2
Particles
over three billion
Mass resolution
1000 M☉
Runs to
today (redshift 0)
Supercomputer
MareNostrum, Barcelona Supercomputing Center (1000 CPUs)
Compute
2 million CPU hours
Led by
Joachim Stadel, Doug Potter, Ben Moore, Jürg Diemand, Piero Madau, Marcel Zemp, Michael Kuhlen, Vicent Quilis
Rather than recompute a whole universe with gas and stars, the Durham-led team cut five spheres out of the existing Millennium Simulation, each about 190 million light-years across, and recalculated them in full detail. The five were chosen to range from emptiest to most crowded, so together they show how a galaxy's surroundings shape the hot gas flowing into and out of it.
Hydrodynamical resimulations of five spheres of radius about 20 Mpc/h cut from the Millennium Simulation, chosen to span voids to cluster regions.
The five regions span -2 to +2 sigma from the mean density, so results can be extrapolated to the whole Millennium volume.
Simulates
dark matter, gas, stars, galaxies
Method
TreePM, SPH
Code
GADGET-3
Mass resolution
up to 106 M☉/h
Runs to
today (redshift 0)
Led by
Robert A. Crain, Tom Theuns, Claudio Dalla Vecchia, Vincent R. Eke, Carlos S. Frenk
Image: Uchuu simulation (GreeM code, ATERUI II), zoom on a massive galaxy cluster; Uchuu collaboration / Skies & Universes (Ishiyama et al. 2021)
Method
N-body, TreePM
A Japanese program for one job done very fast: working out how billions of particles of dark matter, the invisible mass that outweighs ordinary matter about five to one, pull on one another. Its trick is splitting space between thousands of processors so that hardly any of them sit idle waiting for the rest. That efficiency let it run Uchuu, with 2.1 trillion particles.
Massively parallel TreePM N-body code from Japan whose recursive multi-section domain decomposition keeps load-balancing losses near 4 percent.
Ran Uchuu, 2.1 trillion (12800^3) dark matter particles, on the Aterui II supercomputer at the National Astronomical Observatory of Japan.
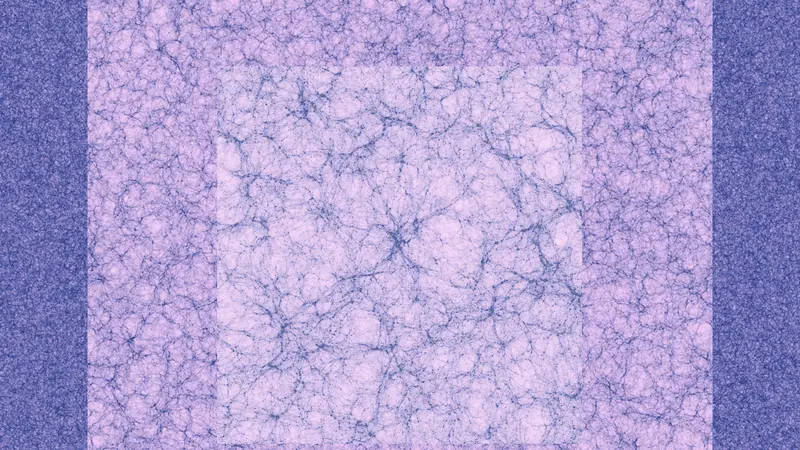
Image: C. Pichon & R. Teyssier, Horizon Project: multi-resolution view of Horizon 4π (outer 16 Gpc/h unfolded slice, 2 Gpc/h slice, inner region at initial-condition resolution)
Box
2,000 Mpc/h
Particles
7.0 × 10¹⁰
Machine
BULL Novascale
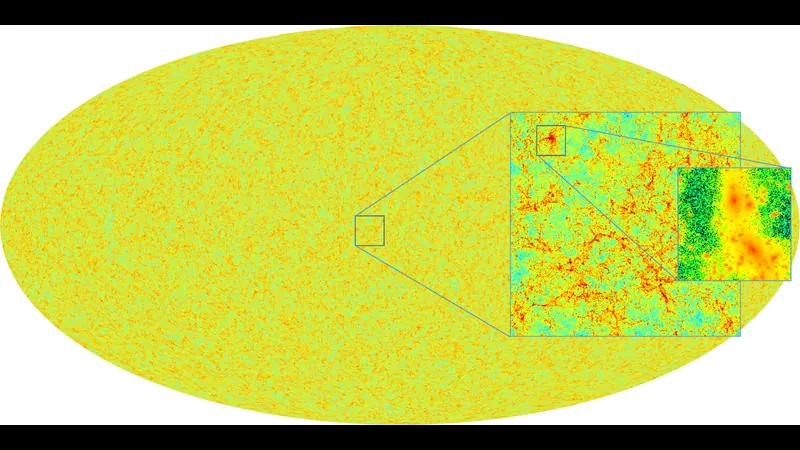
French astronomers filled a cube about nine billion light-years wide with 70 billion particles of dark matter on a supercomputer, then looked out from inside it. They traced how light from distant galaxies would be gently bent by all that mass on its way to us, and turned the result into a map of the whole sky that they shared with other researchers.
A 70-billion-particle RAMSES run in a 2 Gpc/h box used to build a full-sky weak lensing convergence map, which was released to the community.
The AMR grid held more than 140 billion cells, and the run took two months on 6144 Itanium2 processors.
Simulates
dark matter, large-scale structure
Method
N-body, AMR
Code
RAMSES
Box
2,000 Mpc/h on a side
Particles
70 billion
Runs to
today (redshift 0)
Supercomputer
BULL Novascale 3045 (6144 Itanium2 processors), CEA, hosted by CCRT, France
Led by
Romain Teyssier, Sandrine Pires, Simon Prunet, Dominique Aubert, Christophe Pichon
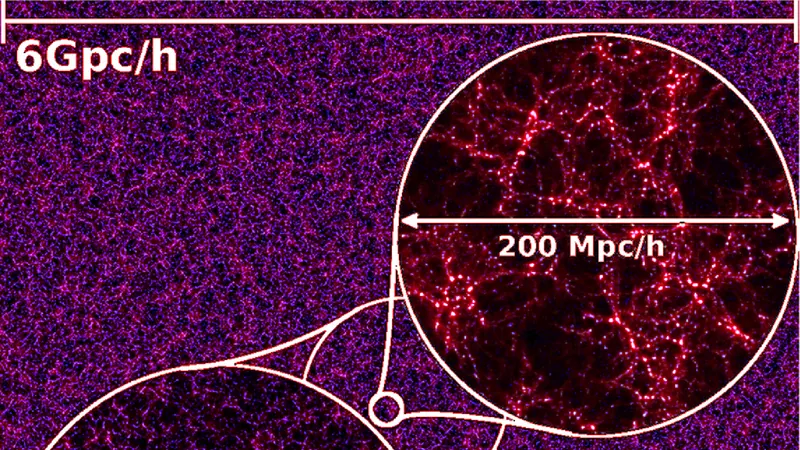
A Korean team simulated a cube of universe so large, about 30 billion light-years across, that from one corner to the other it reaches the edge of what we can observe. They wanted to predict how giant red galaxies would be scattered across the sky, so that a major American galaxy survey of the time, SDSS-III, would have a realistic copy to test its methods on.
A Korean run with 70 billion particles in a 6.6 Gpc/h box built to model luminous red galaxies and baryon acoustic oscillations for SDSS-III.
Its volume is over 2000 times that of the Millennium Run, and corner to corner it stretches to the horizon.
Simulates
dark matter, large-scale structure
Method
N-body, TreePM
Code
GOTPM
Box
6,592 Mpc/h on a side
Particles
41203 (69.9 billion)
Runs to
today (redshift 0)
Supercomputer
TACHYON SUN Blade system, KISTI Supercomputing Center (1648 CPU cores)
Compute
about 25 days wall-clock
Led by
Juhan Kim, Changbom Park, J. Richard Gott, John Dubinski
Take the famous Millennium universe and shrink the box to a fifth of its width, a cube about 470 million light-years on a side, while keeping the same ten billion particles. Every particle now stands for far less mass, so the computer can follow the faint clumps of dark matter around which the smallest galaxies, like the dwarfs near our Milky Way, gather.
Same particle number as Millennium in a box one-fifth the size, giving 125 times better mass resolution down to haloes like those of Local Group dwarfs.
The Milky Way haloes of the Aquarius Project were picked from a lower-resolution version of Millennium-II.
Simulates
dark matter, large-scale structure, dwarf galaxies
Method
N-body, TreePM
Code
GADGET-3
Box
100 Mpc/h on a side
Particles
21603 (≈1.0078×10¹⁰)
Mass resolution
6.9×10⁶ M☉/h
Runs to
today (redshift 0)
Supercomputer
IBM Power-6, Max-Planck Computing Center, Garching (2048 cores, ≈8 TB memory)
Compute
≈1.4 million CPU hours
Led by
Michael Boylan-Kolchin, Volker Springel, Simon D. M. White, Adrian Jenkins, Gerard Lemson
Gas in a simulation can be carried on particles that drift with the flow, or on a fixed grid of boxes. Volker Springel's program does both at once: space is cut into irregular cells that move and stretch with the gas, like a fishing net carried by the current. That made it the engine behind Illustris and IllustrisTNG, and it has been freely available since 2020.
Solves gas dynamics on a Voronoi mesh whose cells move with the flow, combining the adaptivity of particle codes with the shock accuracy of grid codes.
The code behind Illustris and IllustrisTNG; its public version was released in 2020 (Weinberger, Springel & Pakmor, ApJS 248, 32).
Simulates
dark matter, gas, stars, black holes, magnetic fields, galaxies
Image: Gottloeber et al. 2010, arXiv:1005.2687, Fig. 2
Most computer universes start from random ripples, so the galaxies they grow are typical but not ours. The CLUES team began instead from a map of real nearby galaxies, working backwards to the starting conditions that would grow our own neighbourhood. The result is a copy of the Local Group, the Milky Way and Andromeda and their companions, sitting in its true cosmic setting.
A programme of simulations whose initial conditions are built from the observed nearby galaxy distribution, so the Local Group forms in its real setting.
CLUES also tested a warm dark matter cosmology against the observed spectrum of local mini-voids.
Simulates
dark matter, Milky Way analogues, large-scale structure
Image: Heitmann et al. 2010 (Coyote Universe I), arXiv:0812.1052, Fig. 5: particle visualisations of 8 Mpc/h test boxes at z=10 from different starting redshifts (convergence runs of the suite)
Could computer universes be trusted to one part in a hundred? A team led from Los Alamos National Laboratory ran a whole campaign of dark matter simulations to find out, and showed that they could, for how strongly matter clumps on all but the smallest scales. It was the first step toward a quick calculator that predicts what the universe looks like for any mix of ingredients, without a new supercomputer run each time.
A simulation campaign showing that N-body runs can predict the nonlinear matter power spectrum to 1 per cent, first step toward a high-accuracy prediction scheme.
It showed the nonlinear matter power spectrum can be computed to 1 per cent accuracy out to k of about 1 h/Mpc.
Simulates
dark matter, dark energy, large-scale structure
Method
N-body
Runs to
today (redshift 0)
Led by
Katrin Heitmann, Martin White, Christian Wagner, Salman Habib, David Higdon
Image: Schaye et al. 2009, arXiv:0909.5196, Fig. 2
Box
100 Mpc/h
Particles
2.7 × 10⁸
Machine
Cosmology Machine (Durham)
More than fifty small universes, run with gas, stars and black holes, where the team changed one ingredient at a time: how much stars blow out, how gas cools, what black holes do. Like a cook testing a recipe by altering a single spice, they could see which processes really decide how many stars the universe makes, and when.
More than fifty cosmological SPH runs that switched galaxy-formation physics on and off one at a time, to see which processes shape the cosmic star formation history.
OWLS ran on the supercomputer that serves as the correlator for the LOFAR radio telescope.
Simulates
dark matter, gas, stars, black holes, galaxies
Method
TreePM, SPH
Code
GADGET (modified)
Box
100 Mpc/h on a side
Particles
2×5123 per production run (boxes 6.25 to 100 Mpc/h)
Mass resolution
REF L100N512: gas 8.7×10⁷, DM 4.1×10⁸ M☉/h
Supercomputer
Stella, the LOFAR BlueGene/L system in Groningen; Cosmology Machine (ICC Durham); Darwin (Cambridge)
Led by
Joop Schaye, Claudio Dalla Vecchia, C. M. Booth, Robert P. C. Wiersma, Tom Theuns
Bolshoi, from the Russian word for 'great' or 'grand', followed 8.6 billion particles of dark matter in a cube about 1.2 billion light-years wide. It tracked the clumps where galaxies form, and the smaller clumps orbiting inside them, with enough care that astronomers could give each clump a galaxy and reproduce how fast real galaxies spin for their brightness. Its data were published for anyone to use.
An 8-billion-particle box with WMAP-era parameters that tracked haloes and subhaloes well enough to reproduce the Tully-Fisher relation by abundance matching.
Halo statistics are excellent: about ten million haloes at any moment and fifty million over the whole history.
Simulates
dark matter, large-scale structure, galaxies
Method
N-body, AMR
Code
ART
Box
250 Mpc/h on a side
Particles
20483 (≈8.6 billion)
Mass resolution
1.35×10⁸ M☉/h
Runs to
today (redshift 0)
Supercomputer
Pleiades, NASA Ames Research Center (13,824 cores, 13 TB RAM)
Led by
Anatoly Klypin, Sebastian Trujillo-Gomez, Joel Primack
Institutions
NASA Ames Research Center, New Mexico State University, UC Santa Cruz
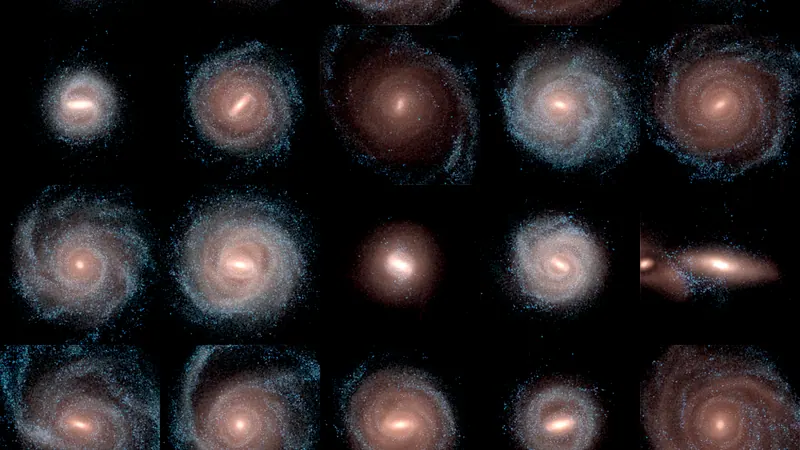
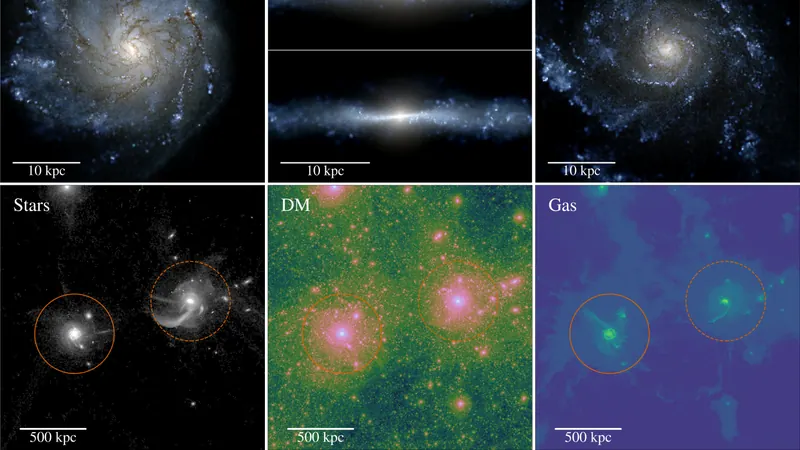
For years, computer-made spiral galaxies came out wrong, with bloated central bulges and discs that were too small. Eris was one carefully grown galaxy that finally looked like the Milky Way. The key change: stars were allowed to form only where gas was very dense, about 5 atoms per cubic centimetre instead of the usual 0.1, so stars formed in dense clusters, as they do in nature.
A single very high resolution zoom that produced a realistic Milky Way-like disc galaxy, after earlier attempts had made bulges far too large.
Its key change was a high star formation density threshold of 5 atoms per cubic centimetre instead of the usual 0.1.
Simulates
dark matter, gas, stars, Milky Way analogues
Method
tree, SPH
Code
GASOLINE
Particles
18.6 million particles within the final virial radius
Mass resolution
DM 9.8×10⁴ M☉; gas 2×10⁴ M☉
Runs to
today (redshift 0)
Supercomputer
NASA Pleiades; UCSC Pleiades cluster; Swiss National Supercomputing Centre ROSA Cray XT5
Compute
1.5 million CPU hours (paper); 1.4 million processor-hours on NASA Pleiades (press release)
Led by
Javiera Guedes, Simone Callegari, Piero Madau, Lucio Mayer
Institutions
University of California, Santa Cruz, Institute for Theoretical Physics, Zurich
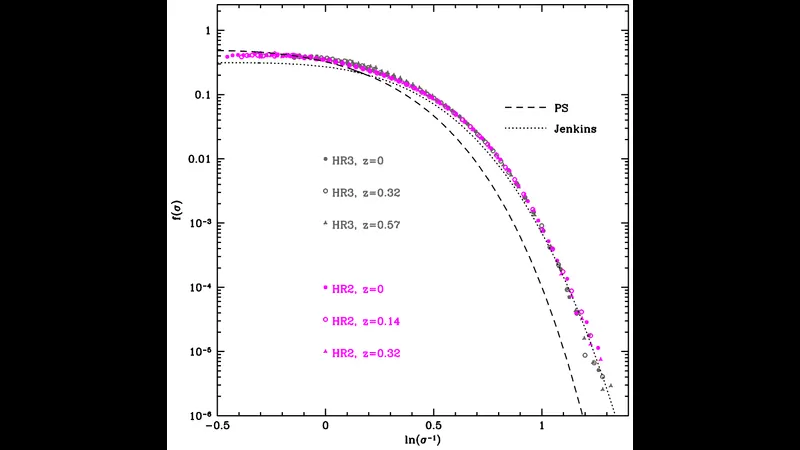
Image: Kim et al. 2011, JKAS 44, 217, arXiv:1112.1754, Fig. 8: halo multiplicity function of HR2 (purple) and HR3 (grey) from FoF halos, compared with Press-Schechter and Jenkins fits (rendered from the arXiv source file fig7.eps)
Box
7,200 Mpc/h
Particles
2.2 × 10¹¹
The sharper of two giant Korean runs from 2011: 216 billion particles of dark matter in a cube about 34 billion light-years wide. From it the team built eight fake skies showing what the BOSS galaxy survey should see, so astronomers could rehearse their analysis on a universe whose answers they already knew.
The higher-resolution of the two 2011 Horizon Runs: 216 billion particles in a 7.2 Gpc/h box, with mock BOSS surveys along the past light cone.
Eight all-sky mock surveys out to redshift 0.7 were made from HR2 to mimic the BOSS geometry.
Simulates
dark matter, large-scale structure
Method
N-body, TreePM
Code
GOTPM
Box
7,200 Mpc/h on a side
Particles
60003 (216 billion)
Runs to
today (redshift 0)
Led by
Juhan Kim, Changbom Park, Graziano Rossi, Sang Min Lee, J. Richard Gott
Image: Kim et al. 2011, arXiv:1112.1754, Fig. 3: matter density in the past light cone (30 Mpc/h slice through the centre of the Horizon Run 3 box, out to z≈4)
Box
10,815 Mpc/h
Particles
3.7 × 10¹¹
Twin of Horizon Run 2, traded for size: 374 billion particles in a cube roughly 50 billion light-years across, more than 8800 times the volume of the Millennium Run. Such a vast space lets researchers study the overall shape of the cosmic web, its voids and walls, and measure faint regular ripples in how galaxies are spaced.
374 billion particles in a box 10.8 Gpc/h across, among the largest volumes ever simulated, used for topology and BAO studies.
Its volume is over 8800 times that of the Millennium Run.
Simulates
dark matter, large-scale structure
Method
N-body, TreePM
Code
GOTPM
Box
10,815 Mpc/h on a side
Particles
72103 (374 billion)
Runs to
today (redshift 0)
Led by
Juhan Kim, Changbom Park, Graziano Rossi, Sang Min Lee, J. Richard Gott
Every computer universe has to begin somewhere: a precise list of where each particle sits and how fast it moves just after the Big Bang. MUSIC writes that starting list, with fine detail in one chosen region and coarse detail elsewhere, so a team can zoom in on a single galaxy. Its output feeds many of the major simulation codes, and its starting positions were far more precise than earlier tools.
MUlti-Scale Initial Conditions: generates nested-grid zoom initial conditions for many codes, including RAMSES, Enzo, GADGET, AREPO, ART, PKDGRAV and Nyx.
Cut displacement and velocity errors to around 10^-4, about two orders of magnitude better than earlier approaches.
The first computer simulation of the entire observable universe: everything from our position out to the farthest light we can receive, rebuilt from 550 billion particles on France's CURIE supercomputer. It was part of a programme testing what dark energy, the unknown cause of the universe's speeding-up expansion, might be. The run produced about 50 petabytes of data, squeezed to 500 terabytes as it went.
The first N-body simulation of the entire observable universe, run on France's CURIE supercomputer for the DEUS dark energy programme.
About 50 PB of data were generated during the run and reduced on the fly to 500 TB of stored data.
Simulates
dark matter, dark energy, large-scale structure
Method
N-body, AMR
Code
RAMSES-DEUS
Box
21,000 Mpc/h on a side
Particles
≈550 billion (81923)
Runs to
today (redshift 0)
Supercomputer
BULL supercomputer CURIE (4752 of 5040 thin nodes), France
Compute
10 million hours
Led by
Jean-Michel Alimi, Vincent Bouillot, Yann Rasera, Vincent Reverdy, Pier-Stefano Corasaniti
Image: Max Planck Institute for Astrophysics (page copyright: Max Planck Gesellschaft e.V.)
Box
3,000 Mpc/h
Particles
3.0 × 10¹¹
Machine
JuRoPA
The Millennium idea scaled up enormously: 303 billion particles in a cube roughly 13 billion light-years across, run in 2010 on almost all the memory of a German supercomputer. Such a huge volume holds many of the rarest, heaviest galaxy clusters, letting researchers check how a cluster's mass relates to the light, X-rays and lensing that astronomers actually measure.
A 303-billion-particle run in a 4.1 Gpc box, carried out in 2010, used to study how galaxy cluster observables scale with mass and with each other.
Run in late summer 2010 on JuRoPA, it used nearly the whole machine's physical memory, about 28.5 TB.
Simulates
dark matter, large-scale structure, clusters, galaxies
Galaxy clusters are the largest objects held together by their own gravity, hundreds or thousands of galaxies in one cloud of dark matter. The Phoenix team recomputed nine of them in fine detail and found that they are built much like a single galaxy's dark matter cloud, only bigger, but younger and still settling down after recent collisions.
Nine rich galaxy clusters resimulated in dark matter alone, showing that cluster haloes resemble scaled-up galaxy haloes but are younger and less relaxed.
Resolved subhaloes make up only 11 ± 3 per cent of the virial mass of the Phoenix clusters.
Simulates
dark matter, clusters
Method
N-body, TreePM
Particles
≈130 million within the virial radius for eight clusters; over one billion for one
Runs to
today (redshift 0)
Supercomputer
Lenovo DeepComp7000, Supercomputing Center of the Chinese Academy of Sciences, Beijing; Cosmology Machine, ICC Durham
Led by
Liang Gao, Julio F. Navarro, Carlos S. Frenk, Adrian Jenkins, Volker Springel, Simon D. M. White
Institutions
National Astronomical Observatories, Chinese Academy of Sciences, Durham ICC
Image: Particles in 2LPT, COLA and GADGET runs: Koda et al. 2016, MNRAS 459, 2118, arXiv:1507.05329, Fig. 1
Method
N-body, PM
A shortcut for computer universes. The slow, gentle motions of matter on the largest scales can be worked out with pen-and-paper mathematics; COLA does that analytically and uses the expensive particle calculation only for the small, messy details. With as few as ten steps it gets the clumps right, which makes it possible to generate many test universes quickly.
COmoving Lagrangian Acceleration: solves large scales with perturbation theory and leaves only small scales to the N-body step, trading small-scale accuracy for speed.
Ten time steps were enough to get halo statistics right down to 10^11 Msun/h in a 100 Mpc/h test box.
Simulates
dark matter, large-scale structure
Method
N-body, PM
Led by
Svetlin Tassev, Matias Zaldarriaga, Daniel Eisenstein
Image: Ishiyama et al. 2011, arXiv:1101.2020, Fig. 2
Box
30 Mpc
Particles
8.6 × 10⁹
Machine
Cray XT4 (NAOJ)
A computer universe about 100 million light-years across, run on four supercomputers at the same time, in Japan and Europe, linked by network. Splitting the work this way gave the team enough power to follow the tiniest clumps of dark matter, ones small enough to host the faintest dwarf galaxies known around the Milky Way.
A 30 Mpc box run simultaneously across supercomputers on two continents, resolving haloes as small as ultra-faint dwarfs.
Its largest run was spread over four supercomputers at once, coupled with the SUSHI code and the MPWide library.
Simulates
dark matter, dwarf galaxies
Method
N-body, TreePM
Code
GreeM / SUSHI
Box
30 Mpc on a side
Particles
20483
Mass resolution
1.28×10⁵ M☉
Runs to
today (redshift 0)
Supercomputer
Four supercomputers linked in a grid, including Cray XT4 machines at NAOJ CfCA and the Edinburgh Parallel Computing Centre
Led by
Tomoaki Ishiyama, Steven Rieder, Junichiro Makino, Simon Portegies Zwart, Derek Groen
Institutions
NAOJ Center for Computational Astrophysics, Edinburgh Parallel Computing Centre, Leiden Observatory, University of Amsterdam, SARA (Amsterdam), CSC – IT Center for Science (Espoo)
Image: Jubilee simulation (CUBEP3M, 6000^3 particles) cosmic web at z=0: Watson et al. 2014, MNRAS 437, 3776, arXiv:1305.1976, Fig. 1
Method
N-body, P3M
A lean, public program that tracks how billions of particles of dark matter pull on each other, written to squeeze the most out of every byte of computer memory. It also spots clumps as they form, while the simulation runs. Researchers have used it to study the era when the first stars lit up the universe and how matter bends light on its way to us.
Public, lean particle-particle particle-mesh N-body code with a runtime halo finder, used for reionization, weak lensing and baryon acoustic oscillation studies.
In extra-lean mode it needs as little as 37 bytes per particle, and has run on more than 27,000 cores.
Simulates
dark matter, large-scale structure, reionization
Method
N-body, P3M
Led by
Joachim Harnois-Déraps, Ue-Li Pen, Ilian T. Iliev, Hugh Merz, J. D. Emberson
Image: Almgren et al. 2013, ApJ 765, 39, arXiv:1301.4498, Fig. 6: Santa Barbara cluster run with Nyx, three orthogonal cuts of dark matter density (blue-white) with 10^7 K gas iso-temperature surfaces (red)
Method
AMR, PM, N-body
A program from Lawrence Berkeley National Laboratory that follows gas and dark matter on a grid of boxes, adding smaller boxes wherever more detail is needed. It is used mostly to model the thin gas between galaxies, which leaves a forest of absorption lines in the light of distant quasars. Its code is open for anyone to use.
Block-structured AMR code for cosmological gas and dark matter, built on the AMReX library and used mainly for the Lyman-alpha forest.
Validated on standard cosmological tests and scaled to 50,000 cores in its first paper; released under a BSD-style licence.
Simulates
dark matter, gas, large-scale structure
Method
AMR, PM, N-body
Led by
Ann Almgren, John Bell, Mike Lijewski, Zarija Lukić, Ethan Van Andel
Image: Gnedin 2025, arXiv:2504.10571, Fig. 2: slices through CROC run "C40A" (top) and Thesan-1 (bottom) at mid-reionization (neutral fraction, photoionization rate, sources)
Box
40 Mpc/h
After the Big Bang the gas between galaxies stayed dark and neutral for hundreds of millions of years, until starlight from the first galaxies broke its atoms apart into charged particles, a change complete within the first billion years. Cosmic Reionization On Computers is Nick Gnedin's long-running programme to recreate that era, following gas, starlight and newborn stars together. Its galaxies match the brightnesses that telescopes observe in the very young universe.
A long-term programme of reionization simulations that couple radiative transfer, gas dynamics and star formation in volumes up to 100 comoving Mpc.
Its calibration runs matched observed galaxy UV luminosity functions at every redshift between 6 and 10. Its cells reach a spatial resolution of 125 pc at redshift 6.
Simulates
dark matter, gas, stars, radiation, reionization, galaxies
Image: Skillman et al. 2014, arXiv:1407.2600, Fig. 1
Box
8,000 Mpc/h
Particles
1.1 × 10¹²
Machine
Titan
A trillion particles of dark matter in a cube about 37 billion light-years wide, run on the Titan supercomputer at Oak Ridge. Beyond the science, the team made a point about sharing: the first 55 terabytes went online so that researchers anywhere could read just the pieces they needed, without downloading the whole thing.
A trillion-particle, 8 Gpc/h tree-code run whose 55 TB early data release was served over the web as a remotely memory-mapped file system.
The authors estimated an equivalent run on Amazon EC2 would have cost at least $200,000 at 2014 spot prices.
Simulates
dark matter, large-scale structure
Method
N-body, tree
Code
2HOT
Box
8,000 Mpc/h on a side
Particles
102403 (1.07×10¹²) in ds14_a
Runs to
today (redshift 0)
Supercomputer
Titan, Oak Ridge (200,000 processors)
Led by
Samuel W. Skillman, Michael S. Warren, Matthew J. Turk, Risa H. Wechsler, Daniel E. Holz
Image: Garrison-Kimmel et al. 2013, arXiv:1310.6746, Fig. 2
Machine
Pleiades, Discover
Our Milky Way has a large neighbour, Andromeda, and the two are falling toward each other. ELVIS recomputed 48 dark matter clouds the size of the Milky Way's, half of them in pairs like ours and half alone, to see whether living as a couple changes the swarm of small satellites around each galaxy. It predicts about a thousand faint galaxies nearby still waiting to be found.
48 galaxy-size haloes, half in Milky Way and Andromeda-like pairs, used to compare paired and isolated hosts in the Local Group.
It predicts about 1000 undiscovered galaxies above 1000 solar masses of stars within roughly 3 Mpc.
Simulates
dark matter, Milky Way analogues, dwarf galaxies
Method
N-body, TreePM
Code
GADGET-3 and GADGET-2
Runs to
today (redshift 0)
Supercomputer
Pleiades (NASA Advanced Supercomputing) and Discover (NASA Center for Climate Simulation)
Led by
Shea Garrison-Kimmel, Michael Boylan-Kolchin, James Bullock, Kyle Lee
Institutions
NASA Advanced Supercomputing Division, NASA Center for Climate Simulation, UC Irvine
Built by a community of astrophysicists and free for anyone, Enzo follows gas and dark matter on a grid that refines itself, adding finer boxes wherever something interesting happens. It handles magnetism, chemistry, light and star formation, so researchers use it for problems from the birth of the first stars to the evolution of galaxies. It runs on anything from a laptop to the largest supercomputers.
Open-source, community-developed block-structured AMR code covering hydrodynamics, MHD, primordial chemistry, radiation transport and star formation in a cosmological setting.
Runs in 1, 2 or 3 dimensions, on anything from a laptop to a Top500 supercomputer, according to the project site.
Simulates
dark matter, gas, stars, magnetic fields, radiation, first stars
Method
AMR, N-body, radiative transfer
Led by
Greg L. Bryan, Michael L. Norman, Brian W. O'Shea, Tom Abel
Stars are not polite neighbours: they blast out light, winds and supernova explosions that stir up and sometimes eject the gas around them. FIRE zooms in on individual galaxies in enough detail to model those blasts directly, instead of tuning a stand-in by hand. Without any adjusted dials, its first round already gave galaxies about the right number of stars for their size.
Zoom simulations that model stellar feedback explicitly from stellar population models, resolving the multiphase interstellar medium instead of relying on tuned subgrid winds.
With zero adjusted feedback parameters, FIRE-1 reproduced the stellar-to-halo mass relation up to haloes of 10^12 solar masses.
Simulates
dark matter, gas, stars, radiation, galaxies, dwarf galaxies, Milky Way analogues
Image: Horizon-AGN simulation (projection of the full volume at z=1.2: gas density green, temperature red, metallicity blue)
Box
100 Mpc/h
Particles
1.1 × 10⁹
Machine
Jade
In Horizon-AGN, a cube about 470 million light-years wide, galaxies form alongside giant black holes whose blasts heat the surrounding gas. The French team used it to watch how galaxies spin relative to the long filaments of the cosmic web: small ones tend to turn along a filament, while larger ones, grown by mergers, often flip to turn across it.
A 100 Mpc/h RAMSES volume with black-hole feedback, used to show how galaxy spins align with or flip relative to cosmic filaments.
Each snapshot between redshift 1.2 and 1.8 holds more than 150,000 galaxies.
Simulates
dark matter, gas, stars, black holes, galaxies, large-scale structure
Method
AMR
Code
RAMSES
Box
100 Mpc/h on a side
Particles
10243 dark matter particles
Mass resolution
DM 8×10⁷ M☉
Supercomputer
Jade (CINES, France)
Compute
4 million CPU hours (Dubois et al. 2014); 6 million CPU hours per project site
A cube of universe about 350 million light-years wide, grown with gas, stars and black holes from shortly after the Big Bang to today. Out of a single set of physical rules came both flat spinning spirals and round elliptical galaxies, a mix that earlier models struggled to produce together. The main run took 19 million CPU hours, about 2000 years for one processor.
A 106.5 Mpc cosmological volume run with the moving-mesh code AREPO that produced a mixed population of spiral and elliptical galaxies from a single galaxy formation model.
The main run used 8,192 cores and 19 million CPU hours, about 2,000 years for one CPU, according to the project site.
Simulates
dark matter, gas, stars, black holes, galaxies, large-scale structure
Method
moving mesh, TreePM
Code
AREPO
Box
106.5 Mpc on a side
Particles
Illustris-1: 18203 gas cells + 18203 DM particles (+18203 MC tracers); '12 billion resolution elements'
Mass resolution
Illustris-1: DM 6.3×10⁶ M☉; gas 1.3×10⁶ M☉
Runs to
today (redshift 0)
Supercomputer
CURIE (CEA/TGCC, France; PRACE project RA0844) and SuperMUC (Leibniz Computing Centre, Germany; project pr85je); further runs on Harvard Odyssey, TACC Ranger and Stampede, and Kraken
Compute
19 million CPU hours for Illustris-1 (8,192 cores, 25 TB peak memory)
Led by
Mark Vogelsberger, Shy Genel, Volker Springel, Paul Torrey, Debora Sijacki, Dylan Nelson, Lars Hernquist
Institutions
MIT, Harvard, HITS (Heidelberg), University of Cambridge
Image: Dolag et al. 2014 (Box2/hr temperature; Gadget-3, Splotch)
Box
2,688 Mpc/h
Particles
1.9 × 10¹¹
A set of German computer universes of different sizes, from about 80 million to 12.5 billion light-years across, all following the same physics with gas, stars, black holes and magnetic fields. The idea was to match what telescopes really measure: the X-ray glow of hot gas in galaxy clusters, the way that gas alters the Big Bang's leftover light, and counts of galaxies.
A ladder of SPH boxes from 18 to 2688 Mpc/h with shared physics, built for comparison with X-ray, Sunyaev-Zeldovich and galaxy surveys.
The Box0/mr image covers 3800 Mpc and holds 1.86×10^11 dark matter, gas, star and black hole particles.
Simulates
dark matter, gas, stars, black holes, magnetic fields, clusters, galaxies, large-scale structure
Method
TreePM, SPH
Code
GADGET-3
Box
2,688 Mpc/h on a side
Particles
Box0/mr: 2×45363 (1.86×10¹¹ particles at z=0)
Mass resolution
mr: DM 1.3×10¹⁰, gas 2.6×10⁹ M☉/h; xhr: DM 1.9×10⁶, gas 3.9×10⁵ M☉/h
ChaNGa computes how dark matter, gas and stars move under gravity, and is written in Charm++, a language that keeps hundreds of thousands of processors busy even when matter crowds into dense knots. Late in cosmic history matter is extremely clumpy, and that leaves many codes waiting on a few overloaded processors. ChaNGa has run efficiently on over half a million cores.
Cosmological N-body and SPH code written in the Charm++ parallel language, designed to handle the extreme clustering of late-time cosmic structure.
Showed strong scaling on up to 512K cores of Blue Waters with 12 and 24 billion particles.
Simulates
dark matter, gas, stars
Method
N-body, tree, SPH
Led by
Harshitha Menon, Lukasz Wesolowski, Gengbin Zheng, Pritish Jetley, Laxmikant Kale
Image: Hubble sequence of EAGLE galaxies (Fig. 2 of Schaye et al. 2015), EAGLE project / Virgo Consortium
Box
100 cMpc
Particles
6.8 × 10⁹
Machine
DiRAC
EAGLE grew a cube of universe about 330 million light-years wide, filled with gas, stars and black holes, from the Big Bang to the present. The team adjusted how strongly stars and black holes push gas away until the galaxies came out with the right mix of masses we see today. The volume holds roughly 10,000 galaxies the size of the Milky Way or larger.
A 100 Mpc cosmological volume whose stellar and black-hole feedback was calibrated to the present-day galaxy mass function, reproducing the galaxy population to within 0.2 dex.
The volume is large enough to hold about 10,000 galaxies the size of the Milky Way or bigger.
Simulates
dark matter, gas, stars, black holes, galaxies
Method
TreePM, SPH
Code
GADGET-3 (heavily modified)
Box
100 cMpc on a side
Particles
Ref-L100N1504: 2×15043 (6.8 billion particles)
Runs to
today (redshift 0)
Supercomputer
DiRAC Data Centric system, Durham (DiRAC-2)
Compute
L100N1504 about 4.5 million CPU hours; more than 1.5 months on 4000 cores
Led by
Joop Schaye, Robert A. Crain, Richard G. Bower, Michelle Furlong, Matthieu Schaller
Institutions
Leiden Observatory, Institute for Computational Cosmology, Durham University
Philip Hopkins built GIZMO from GADGET's foundations to fix a long-standing problem: older ways of tracking gas with particles blurred sharp features like shock waves. GIZMO gives each particle a small patch of space and computes the flow between neighbours, keeping the flexibility of particles with the precision of a grid. It runs the FIRE galaxy simulations and is fully public.
Descended from GADGET, GIZMO introduced meshless finite-mass and finite-volume hydrodynamics that keep particle adaptivity without the main weaknesses of SPH.
Runs the FIRE-2 galaxy-formation simulations; the code is fully public on GitHub with no separate private version.
Simulates
dark matter, gas, stars, black holes, magnetic fields, radiation, cosmic rays, dust
The fourth Korean Horizon Run filled a cube about 15 billion light-years wide with some 250 billion particles and ran non-stop for 50 days on 8000 processors. What sets it apart is its record of family trees: who merged with whom over cosmic time, kept in fine detail so researchers could study how galaxies and the large-scale web grow together.
A 6300^3-particle run in a 3.15 Gpc/h box with dense merger trees, built to study how galaxies and large-scale structure evolve together.
It ran 50 straight days on 8,000 cores of KISTI's Tachyon-II from late November 2013 to early February 2014.
Simulates
dark matter, large-scale structure, galaxies
Method
N-body, TreePM
Code
GOTPM
Box
3,150 Mpc/h on a side
Particles
63003 (≈250 billion)
Mass resolution
≈9×10⁹ M☉/h
Runs to
today (redshift 0)
Supercomputer
Tachyon-II, KISTI (8,000 CPU cores)
Compute
50 days on 8,000 cores (Nov 2013 to Feb 2014)
Led by
Juhan Kim, Changbom Park, Benjamin L'Huillier, Sungwook E. Hong
Image: L-PICOLA lightcone dark matter slice: Howlett, Manera & Percival 2015, Astron. Comput. 12, 109, arXiv:1506.03737, Fig. 5
Method
N-body, PM
A fast universe-maker for survey astronomers. Built on the COLA shortcut, it produces fake galaxy catalogues about a thousand times faster than a full simulation while staying within 2 per cent on the scales that matter most. Teams need thousands of such fakes to judge how much of what they measure could be chance, and L-PICOLA is freely available.
Distributed-memory COLA code for fast mock galaxy catalogues, with primordial non-Gaussianity and on-the-fly lightcones, released under GPL-2.0.
About 1000 times faster than a full N-body run while matching dark matter clustering to within 2 percent on BAO scales.
Image: Khandai et al. 2014, arXiv:1402.0888, Fig. 2
Box
100 Mpc/h
Particles
1.2 × 10¹⁰
Machine
Kraken
Gas, stars and giant black holes fill MassiveBlack-II, a cube about 470 million light-years wide: the most detailed run of its size at the time to follow star birth and black hole feeding all the way to the present. It also measured how much ordinary matter changes the number of dark matter clumps compared with simulations that leave it out.
The highest-resolution simulation of its size at the time to include star formation, black hole accretion and feedback, run to redshift zero.
Baryons changed halo abundance by 20 to 35 per cent below the knee of the mass function compared with dark-matter-only fits.
Simulates
dark matter, gas, stars, black holes, galaxies
Method
TreePM, SPH
Code
P-GADGET
Box
100 Mpc/h on a side
Particles
2×17923
Mass resolution
DM 1.1×10⁷, gas 2.2×10⁶ M☉/h
Runs to
today (redshift 0)
Supercomputer
Cray XT5 Kraken, National Institute for Computational Sciences
Led by
Nishikanta Khandai, Tiziana Di Matteo, Rupert Croft, Stephen M. Wilkins, Yu Feng
One hundred galaxies, from small dwarfs to Milky Way-sized ones, each grown separately at high detail but all with the same rules for how stars blast energy back into their surroundings. Using one set of rules across such a range showed that this stellar push alone is enough to keep the right number of stars in galaxies smaller than ours.
One hundred zoom simulations from dwarf to Milky Way mass, all with the same feedback, showing that stellar feedback alone limits star formation below Milky Way mass.
The haloes were picked to sample merger histories, concentrations and spins without bias.
Simulates
dark matter, gas, stars, galaxies, dwarf galaxies, Milky Way analogues
Method
tree, SPH
Code
Gasoline (improved SPH)
Runs to
today (redshift 0)
Supercomputer
theo cluster (MPIA); hydra cluster (Rechenzentrum Garching); Milky Way supercomputer (DFG SFB 881)
Led by
Liang Wang, Aaron A. Dutton, Gregory S. Stinson, Andrea V. Macciò, Camilla Penzo
Image: Heitmann et al. 2014, arXiv:1411.3396, Fig. 2
Box
923 Mpc/h
Particles
5.5 × 10¹¹
Machine
Titan
Over half a trillion dark matter particles in a cube about four billion light-years wide, run on almost 90 per cent of Titan, a supercomputer that drew much of its power from graphics chips. From it the team built synthetic skies: catalogues of where galaxies should appear, to help prepare large sky surveys such as DESI and LSST.
Over half a trillion particles in a 1300 Mpc box, run on almost 90 per cent of the GPU supercomputer Titan to build synthetic sky catalogues.
It used almost 90 per cent of Titan, including the machine's GPU accelerators.
Simulates
dark matter, large-scale structure
Method
N-body, PM
Code
HACC
Box
923 Mpc/h on a side
Particles
81923 (0.55 trillion)
Mass resolution
1.48×10⁸ M☉ (1.05×10⁸ M☉/h)
Runs to
today (redshift 0)
Supercomputer
Titan (GPU-accelerated), Oak Ridge Leadership Computing Facility (16,384 nodes)
Led by
Katrin Heitmann, Nicholas Frontiere, Chris Sewell, Salman Habib, Adrian Pope
Institutions
Argonne National Laboratory, Oak Ridge Leadership Computing Facility
Hundreds of the earliest galaxies, caught as they were born. The Renaissance team recalculated three regions, one crowded, one average and one nearly empty, in extremely fine detail, and followed them through the first few hundred million years after the Big Bang. They found that the smallest clumps of dark matter do not always manage to make stars.
Adaptive-mesh resimulations of rare-peak, normal and void regions that follow hundreds of the earliest galaxies from redshift 25 to 8.
Below about 2×10^8 solar masses, haloes do not always host stars, which flattens the faint end of the early galaxy luminosity function.
Simulates
dark matter, gas, first stars, stars, radiation, galaxies
Method
AMR, radiative transfer
Code
Enzo
Box
28.4 Mpc/h on a side
Particles
effective 40963 in resimulated regions
Supercomputer
Blue Waters, NCSA
Led by
Brian W. O'Shea, John H. Wise, Hao Xu, Michael L. Norman
Part of EAGLE (Evolution and Assembly of GaLaxies and their Environments)
Image: Till Sawala (detail of image), via University of Victoria Astronomy Research Centre: dark matter and stars in an APOSTLE Local Group volume
Machine
DiRAC
Twelve computer copies of our own Local Group: a Milky Way and an Andromeda, with their swarms of small companion galaxies, built with stars and gas as well as dark matter. The question was whether the standard picture of the universe produces too many little satellite galaxies, as had long been feared. With ordinary matter included, the counts came out close to what we see around us.
Twelve zoom simulations of Local Group lookalikes run with the EAGLE model, showing that standard cold dark matter can match the Milky Way and Andromeda satellite counts.
APOSTLE addressed the missing satellites, too-big-to-fail and planes-of-satellites puzzles in a single suite.
Simulates
dark matter, gas, stars, galaxies, Milky Way analogues, dwarf galaxies
Method
TreePM, SPH
Code
EAGLE code (modified GADGET-3)
Mass resolution
L1: gas about 1.0×10⁴, DM about 5.0×10⁴ M☉; L3: 1.5×10⁶ / 7.5×10⁶ M☉
Runs to
today (redshift 0)
Supercomputer
DiRAC Data Centric system, Durham
Led by
Till Sawala, Carlos S. Frenk, Azadeh Fattahi, Julio F. Navarro, Richard G. Bower
BlueTides recreates the cosmic dawn, when the first galaxies and the first bright black holes, quasars, were switching on. It follows a cube about 1.9 billion light-years across with 697 billion particles, but only through the first 650 million years or so, which let it catch very rare, very bright objects. At the time it was the biggest simulation of the early universe that included gas.
A 400 Mpc/h box of the first galaxies and quasars, run from redshift 99 to 8, the largest hydrodynamic simulation of the early universe at the time.
BlueTides followed 697 billion particles of gas and dark matter.
Simulates
dark matter, gas, stars, black holes, galaxies, reionization
Method
TreePM, SPH
Code
MP-Gadget (pressure-entropy SPH)
Box
400 Mpc/h on a side
Particles
2×70403 (697 billion)
Runs to
redshift 8
Supercomputer
Blue Waters, NCSA (81,000 MPI ranks)
Compute
2.6 million node-hours
Led by
Yu Feng, Tiziana Di Matteo, Rupert A. Croft, Simeon Bird, Nicholas Battaglia
Image: Stefan Gottlöber (AIP), CosmoSim / MultiDark project: density slice through the MultiDark-Planck (MDPL) simulation at z=0.51, full 1 Gpc/h box
Box
250 Mpc/h
Particles
8.6 × 10⁹
Machine
Pleiades
In 2013 the Planck satellite measured the ingredients of the universe more precisely, finding a little more matter than earlier estimates. So the team behind Bolshoi, a well-known dark matter simulation, ran it again with the new numbers, in a cube about 1.2 billion light-years across. The extra matter meant big clumps of dark matter grew earlier in cosmic history than in the old run.
A rerun of Bolshoi with Planck cosmological parameters, which raised the abundance of massive haloes at high redshift relative to the WMAP-based run.
The higher matter density of Planck parameters produces more massive haloes at high redshift than WMAP parameters do.
Simulates
dark matter, large-scale structure
Method
N-body
Box
250 Mpc/h on a side
Particles
20483 (Bolshoi-Planck)
Runs to
today (redshift 0)
Supercomputer
Pleiades, NASA Ames (Bolshoi-Planck)
Led by
Aldo Rodríguez-Puebla, Peter Behroozi, Joel Primack, Anatoly Klypin
Image: Griffen et al. 2015, arXiv:1509.01255, Fig. 1
Caterpillar zooms in, one host at a time, on the dark matter around galaxies like our Milky Way, in very fine detail. Snapshots were saved every 5 million years, often enough to catch the birthplaces of the very first stars and the faintest dwarf galaxies. Each host turned out to be swarming with about 20,000 smaller clumps of dark matter.
The largest set of very high resolution Milky Way-mass zooms of its time, with snapshots every 5 Myr to trace the first stars and faint dwarfs.
Each host halo contains about 20,000 bound subhaloes inside its virial radius.
Simulates
dark matter, Milky Way analogues, dwarf galaxies
Method
N-body
Mass resolution
≈104 M☉ per particle
Runs to
today (redshift 0)
Compute
≈14 million CPU hours (whole project, with ≈700 TB storage)
Led by
Brendan F. Griffen, Alexander P. Ji, Gregory A. Dooley, Facundo A. Gómez, Mark Vogelsberger, Anna Frebel
Image: Hellwing et al. 2015, arXiv:1505.06436, Fig. 2
Box
17.4 Mpc/h (radius of high-resolution sphere)
A magnifying glass inside a computer universe. Most of the computing power goes into one sphere about 160 million light-years across, followed in far finer detail than the rest of the box, so that clumps of dark matter spanning a hundred-million-fold range in mass can be counted in the same run. A twin version swaps in warmer dark matter to see which small clumps disappear.
A 17.4 Mpc/h high-resolution sphere inside a larger box that gives the halo mass function over eight orders of magnitude, with a warm dark matter twin.
Its particle mass is 60 times smaller than Millennium-II's, and it forms about 60 galaxy-size haloes of ten million particles each.
Simulates
dark matter, large-scale structure, dwarf galaxies
Method
N-body
Box
17.4 Mpc/h (radius of high-resolution sphere) on a side
Mass resolution
1.135×10⁵ M☉/h
Runs to
today (redshift 0)
Led by
Wojciech A. Hellwing, Carlos S. Frenk, Marius Cautun, Sownak Bose, John Helly, Adrian Jenkins
Image: Ocvirk et al. 2015, arXiv:1511.00011, Fig. 1
Box
91 Mpc
Particles
6.9 × 10¹⁰
Machine
Titan
For hundreds of millions of years after the Big Bang, space was filled with a fog of neutral hydrogen, until starlight split the atoms apart and cleared it. CoDa I followed that clearing, with the light itself tracked as it travelled, in a model of our own neighbourhood about 300 million light-years across. The starting conditions were tuned so that the Milky Way's surroundings form in the right places.
The first fully coupled radiation-hydrodynamics simulation of reionization in a model of our own Local Universe, run on a hybrid CPU-GPU code.
Initial conditions were constrained so that the Local Group and nearby structures form in the right places.
Simulates
dark matter, gas, stars, radiation, reionization, galaxies
Method
AMR, radiative transfer
Code
RAMSES-CUDATON
Box
91 Mpc on a side
Particles
40963 particles and cells
Runs to
redshift 4.23
Supercomputer
Titan, Oak Ridge National Laboratory (8192 cores and 8192 GPUs)
Led by
Pierre Ocvirk, Nicolas Gillet, Paul R. Shapiro, Dominique Aubert, Ilian T. Iliev, Romain Teyssier
Image: Wang et al. 2016, arXiv:1608.01763, Fig. 1: SDSS galaxies, groups, reconstructed mass field and (right panel) the ELUCID constrained simulation at z=0 in a 10 Mpc/h slice containing the Sloan Great Wall
Box
500 Mpc/h
Particles
2.9 × 10¹⁰
Random computer universes only resemble ours in general. ELUCID instead worked backwards from the galaxies mapped by the Sloan Digital Sky Survey to find a starting state that grows into our actual neighbourhood, a cube about 2.3 billion light-years across. Astronomers can then look up the hidden dark matter surroundings of real, catalogued galaxies.
A constrained simulation of the SDSS DR7 volume from reconstructed initial conditions, letting the environment of each observed galaxy be read off directly.
Because it reproduces the real volume, cosmic variance is greatly reduced even for small samples.
Simulates
dark matter, large-scale structure
Method
N-body, TreePM
Code
L-GADGET (memory-optimised GADGET-2)
Box
500 Mpc/h on a side
Particles
30723
Runs to
today (redshift 0)
Led by
Huiyuan Wang, H. J. Mo, Xiaohu Yang, Youcai Zhang, Y. P. Jing
Image: Joe Insley, Silvio Rizzi and HACC Cosmology Code Team/Argonne National Laboratory (via OLCF)
Method
N-body, PM, tree
Supercomputers change every few years, so a team at Argonne National Laboratory built HACC to run well on whichever one is available, from older IBM Blue Gene machines to new graphics-chip systems. It computes how vast numbers of particles of dark matter, the invisible mass that outweighs ordinary matter, pull on one another over cosmic time. In tests it moved more than 3.6 trillion particles.
Hardware/Hybrid Accelerated Cosmology Code: an N-body framework built to run on every major supercomputer architecture, from Blue Gene to GPU machines.
The 2016 paper reports benchmarks evolving more than 3.6 trillion particles.
Simulates
dark matter, large-scale structure
Method
N-body, PM, tree
Led by
Salman Habib, Adrian Pope, Hal Finkel, Nicholas Frontiere, Katrin Heitmann
Image: Dubois et al. 2016, arXiv:1606.03086, Fig. 2: u-g-i stellar images of massive galaxies in Horizon-AGN matched with their Horizon-noAGN counterparts
A controlled experiment. The Horizon-AGN universe was run a second time with one thing removed: the energy that giant black holes at galaxy centres pump into their surroundings. Comparing the two runs shows what those black holes do: without them, the biggest galaxies in groups and clusters grow flat spinning discs again instead of becoming round, featureless ellipticals.
A twin of Horizon-AGN with black-hole feedback switched off, used to isolate what active nuclei do to galaxy shapes.
Without AGN feedback, massive galaxies at the centres of groups and clusters regrow discs instead of becoming ellipticals.
Image: Hopkins et al. 2017, arXiv:1702.06148, Fig. 1 (m12i panel)
Machine
Stampede
One galaxy like the Milky Way, grown from the early universe with enough detail to follow the small dwarf galaxies circling it. The run took 2,048 processors fifteen days, and its smallest time steps were just 180 years. Its little satellites matched those around our own galaxy, easing two long-standing worries that the standard theory predicts too many, or too massive, companions.
A FIRE-2 zoom of a Milky Way-mass galaxy whose satellite dwarfs matched the Local Group without missing-satellite or too-big-to-fail problems.
Its shortest particle time-step was 180 years.
Simulates
dark matter, gas, stars, Milky Way analogues, dwarf galaxies
Method
meshless
Code
GIZMO (FIRE-2)
Mass resolution
baryon particle mass 7070 M☉; gas softening down to 1 pc
Runs to
today (redshift 0)
Supercomputer
Stampede (2048 cores for 15 days)
Compute
720,000 CPU-hours
Led by
Andrew R. Wetzel, Philip F. Hopkins, Ji-hoon Kim, Claude-André Faucher-Giguère, Dusan Keres
Image: Heitmann et al. 2016, ApJ 820, 108, arXiv:1508.02654, Fig. 11: coverage of the halo mass function model space by the Mira-Titan simulation design at z = 0 (red), with test models (dark blue) and LCDM (light blue) (rendered from the arXiv source file massf_z0.pdf)
Nobody can afford a full computer universe for every possible mix of cosmic ingredients, so this Argonne-led campaign laid out a carefully chosen set and showed that as few as 26 are enough to start. From those, an emulator learns to predict the result for any mix in between, the way a few well-placed thermometers let you map a whole room. The mixes vary eight ingredients, including the mass of neutrinos and the behaviour of dark energy.
An emulator campaign over an 8-parameter space including massive neutrinos and evolving dark energy, designed so accuracy can grow as runs are added.
Its sampling scheme builds precision emulators from just 26 cosmological models.
Simulates
dark matter, neutrinos, dark energy, large-scale structure
Method
N-body
Code
HACC
Led by
Katrin Heitmann, Derek Bingham, Earl Lawrence, Steven Bergner, Salman Habib
Image: ASTRID (MP-Gadget): Ni et al. 2022, MNRAS 513, 670, arXiv:2110.14154, Fig. 1
Method
N-body, TreePM, SPH
Descended from the widely used GADGET code, MP-Gadget was reworked to spread one calculation over as many as half a million processors. It handles dark matter, gas, stars, black holes and neutrinos. It is the engine behind the BlueTides and ASTRID simulations, and its code is free for anyone to use and modify.
Massively parallel GADGET derivative from P-Gadget/GADGET-2 with GADGET-4's gravity solver, reworked for scaling to half a million cores.
The code used for the BlueTides and ASTRID simulations; dual-licensed under 3-clause BSD or GNU GPL v2 or later.
Image: Davé, Thompson & Hopkins 2016, MNRAS 462, 3265, arXiv:1604.01418, Fig. 2 (z = 0 panel): galaxy stellar mass function of MUFASA compared with Illustris, EAGLE, MassiveBlack-II and Baldry et al. 2012 (rendered from the arXiv source file mfsim_z0.pdf; the paper has no rendered maps)
Box
50 Mpc/h
Particles
2.5 × 10⁸
Galaxies grow from gas, stars and dark matter in MUFASA, a computer universe about 230 million light-years across. Its makers borrowed the way stars blow gas out of galaxies from the FIRE project, and used a newer method for handling gas. The numbers of galaxies of each size came out close to what telescopes count, from about 12 billion years ago to today.
Cosmological volumes using meshless hydrodynamics and FIRE-inspired outflows, whose galaxy stellar mass functions matched observations from redshift 4 to 0.
The 12.5 Mpc/h companion run resolves every hydrogen-cooling halo.
Simulates
dark matter, gas, stars, galaxies
Method
meshless
Code
GIZMO (meshless finite mass)
Box
50 Mpc/h on a side
Particles
a quarter billion particles
Runs to
today (redshift 0)
Led by
Romeel Davé, Robert J. Thompson, Philip F. Hopkins
Image: CosmoSim (Leibniz Institute for Astrophysics Potsdam); MDPL2 slice with galaxies
Box
4,000 Mpc/h
Particles
6.9 × 10¹⁰
Machine
SuperMUC, Pleiades
A family of computer universes made of dark matter, ranging from cubes about 1.9 billion to 19 billion light-years on a side. Between them they contain more than 60 billion clumps of dark matter, the invisible scaffolding in which galaxies sit. The catalogues were put online for anyone to use, and survey teams relied on them to build fake skies for testing their methods.
A family of Planck-cosmology boxes from 400 Mpc/h to 4 Gpc/h whose public halo catalogues on CosmoSim became standard tools for survey mock catalogues.
Across all MultiDark simulations the total number of dark matter haloes exceeds 60 billion.
Simulates
dark matter, large-scale structure
Method
N-body, TreePM, AMR
Code
GADGET-2 (Planck runs); ART (MultiDark run 1)
Box
4,000 Mpc/h on a side
Particles
MDPL 38403 in 1 Gpc/h; SMDPL 38403 in 400 Mpc/h; BigMDPL 38403 in 2.5 Gpc/h; HMDPL 40963 in 4 Gpc/h
30 Milky Way-mass haloes at level 4, 3 at level 3 (2017); augmented release: 40 Milky Way-mass and 26 dwarf haloes
Machine
SuperMUC, Hazel Hen, DiRAC
Thirty galaxies like our Milky Way, each grown from the early universe with stars, gas, black holes and magnetic fields. They were picked from a larger computer universe and then rerun in fine detail. One lesson concerned the biggest spiral discs: they grew when smaller galaxies merged in gently, adding spinning gas to a disc that was already there.
Thirty magnetohydrodynamic zoom-in simulations of Milky Way-mass galaxies, selected from the EAGLE 100 Mpc dark matter box and run with AREPO and an Illustris-based model.
The largest discs formed through quiet mergers that spiral in and deposit high angular momentum gas into an existing disc.
Simulates
dark matter, gas, stars, black holes, magnetic fields, Milky Way analogues, galaxies
Method
moving mesh, TreePM
Code
AREPO
Particles
30 Milky Way-mass haloes at level 4, 3 at level 3 (2017); augmented release: 40 Milky Way-mass and 26 dwarf haloes
Mass resolution
Level 4: DM 3×10⁵ M☉; baryonic 5×10⁴ M☉
Runs to
today (redshift 0)
Supercomputer
SuperMUC (LRZ, Garching; GCS project PR85JE); DiRAC Data Centric system (Durham); Hornet/Hazel Hen (HLRS Stuttgart)
Compute
Approx. 18 million CPU hours in total (HITS)
Led by
Robert J. J. Grand, Facundo A. Gómez, Federico Marinacci, Rüdiger Pakmor, Volker Springel
Institutions
HITS (Heidelberg), Durham University, MPIA Heidelberg, MIT
Cosmologists measure the universe through how matter is spread out, but exploding stars and black holes push gas around and blur that pattern. BAHAMAS built computer universes about 1.9 billion light-years across whose stars and cluster gas match real observations, so the pattern of matter could be trusted. Later runs used it to estimate how much neutrinos weigh.
Large hydrodynamical volumes whose feedback was calibrated to stellar masses and cluster gas fractions so that cosmologists could trust their matter distribution.
Its later runs were used to place constraints on the summed mass of neutrinos (McCarthy et al. 2018).
Simulates
dark matter, gas, stars, black holes, clusters, large-scale structure, neutrinos
Method
TreePM, SPH
Box
400 Mpc/h on a side
Particles
2×10243 (L400N1024)
Mass resolution
WMAP-9: DM about 3.85×10⁹, initial baryon about 7.66×10⁸ M☉/h
Runs to
today (redshift 0)
Supercomputer
DiRAC Data Centric system, Durham
Led by
Ian G. McCarthy, Joop Schaye, Simeon Bird, Amandine M. C. Le Brun
Institutions
Liverpool John Moores University, Leiden Observatory
Part of EAGLE (Evolution and Assembly of GaLaxies and their Environments)
Image: Bahé et al. 2017, arXiv:1703.10610, Fig. 2
Machine
DiRAC
Clusters of galaxies are the biggest objects held together by gravity, hundreds or thousands of galaxies swarming in hot gas. C-EAGLE grew 30 of them in a computer, using the physics of the EAGLE project, in enough detail to see the individual galaxies inside each cluster. The set covers clusters from about a hundred trillion to about two and a half thousand trillion times the mass of the Sun.
Zoom simulations of 30 galaxy clusters run with the EAGLE model at a resolution that resolves individual member galaxies.
The clusters span 10^14 to 10^15.4 solar masses and include the 24 Hydrangea clusters.
Simulates
dark matter, gas, stars, black holes, clusters, galaxies
Method
TreePM, SPH
Code
EAGLE code (modified GADGET-3)
Mass resolution
gas particle mass 1.8×10⁶ M☉
Runs to
today (redshift 0)
Supercomputer
DiRAC Data Centric system, Durham
Led by
David J. Barnes, Scott T. Kay, Yannick M. Bahé, Claudio Dalla Vecchia, Ian G. McCarthy
Image: Potter, Stadel & Teyssier 2017, Comput. Astrophys. Cosmol. 4, 2, arXiv:1609.08621, Fig. 1: simulated full-sky matter distribution from the 2-trillion-particle Euclid Flagship run, with zoom-in insets (rendered from the arXiv source file full_sky.pdf)
Particles
2.0 × 10¹²
Machine
Piz Daint
Flagship 1 was built to prepare for ESA's Euclid space telescope, which maps the shapes and positions of billions of galaxies. It followed 2 trillion particles of dark matter, the invisible mass that outweighs ordinary matter, on more than 4,000 graphics-chip nodes of the Swiss supercomputer Piz Daint. Its fake galaxy catalogues let the Euclid team rehearse their analysis before real data arrived.
A 2-trillion-particle run for ESA's Euclid mission, completed in 2016 on Piz Daint with the GPU fast-multipole code PKDGRAV3.
PKDGRAV3 also ran the first 8-trillion-particle benchmark on Titan, peaking at 10 Pflops.
Simulates
dark matter, large-scale structure
Method
N-body, FMM
Code
PKDGRAV3
Particles
2 trillion
Runs to
today (redshift 0)
Supercomputer
Piz Daint, Swiss National Supercomputing Centre (CSCS), 4000+ GPU nodes
Compute
350,000 node hours (a little under 80 h wall-clock)
Image: NIHAO galaxies (Gasoline2): Wang et al. 2015, MNRAS 454, 83, arXiv:1503.04818, Fig. 4
Method
N-body, tree, SPH
Gasoline simulates galaxies by representing gas as many soft overlapping particles that carry heat and pressure. Its 2017 update made the gas mix more realistically and taught the code to tell a true shock wave from ordinary squeezing, so it no longer blurs flows that do not need it. It shares its gas physics with the ChaNGa code.
Modern SPH update of Gasoline with turbulent diffusion and gradient-based shock detection; its hydrodynamics is identical to ChaNGa's.
Its shock detector lets it avoid artificial viscosity entirely in compressive flows that are not shocks.
Simulates
dark matter, gas, stars
Method
N-body, tree, SPH
Led by
James W. Wadsley, Benjamin W. Keller, Thomas R. Quinn
Twenty-four computer-grown galaxy clusters, taken from the C-EAGLE set and extended to include the space well around each cluster. The question was how living in a crowded place changes a galaxy. One finding: galaxies near clusters carry more stars than similar ones out in empty space, even quite far beyond the cluster's edge.
A subset of 24 C-EAGLE cluster zooms designed to study how dense environments change galaxies, including well beyond the cluster edge.
Near clusters, haloes hold up to about 0.3 dex more stellar mass than field haloes, even well beyond the cluster virial radius.
Simulates
dark matter, gas, stars, black holes, clusters, galaxies
Method
TreePM, SPH
Code
EAGLE code (modified GADGET-3)
Mass resolution
baryon particle mass about 106 M☉
Runs to
today (redshift 0)
Led by
Yannick M. Bahé, David J. Barnes, Claudio Dalla Vecchia, Scott T. Kay, Simon D. M. White
Part of BAHAMAS (BAryons and HAloes of MAssive Systems)
Image: Barnes et al. 2016, arXiv:1607.04569, Fig. 2
Box
3,200 Mpc
Particles
390 cluster zooms; dark-matter parent run with 25203 particles
Machine
DiRAC
The rarest and heaviest galaxy clusters only show up in huge volumes. MACSIS first built a dark matter universe about 10 billion light-years across, picked out 390 of its most massive clusters, then reran each one with hot gas, stars and black holes using the BAHAMAS physics. This gave a sample of the extreme, scorching clusters that smaller simulations are too cramped to contain.
Resimulations of 390 of the most massive clusters drawn from a 3.2 Gpc dark-matter box, extending the BAHAMAS model to the rarest, hottest systems.
The parent dark-matter volume was a periodic cube 3.2 Gpc on a side.
Simulates
dark matter, gas, stars, black holes, clusters
Method
TreePM, SPH
Code
p-gadget3 (parent run)
Box
3,200 Mpc on a side
Particles
390 cluster zooms; dark-matter parent run with 25203 particles
Mass resolution
parent DM 5.43×10¹⁰ M☉/h
Runs to
today (redshift 0)
Supercomputer
DiRAC Data Centric system, Durham
Led by
David J. Barnes, Scott T. Kay, Monique A. Henson, Ian G. McCarthy, Joop Schaye
Image: Euclid Flagship run (PKDGRAV3): Potter, Stadel & Teyssier 2017, Comput. Astrophys. Cosmol. 4, 2, arXiv:1609.08621, Fig. 1, zoom-in quadrant showing the filamentary matter distribution (cropped from the full-sky map)
Method
N-body, FMM
Machine
Titan, Piz Daint
Written for the graphics chips of modern supercomputers, PKDGRAV3 computes how trillions of particles pull on each other. Instead of measuring every pair of particles, it groups distant ones together, the way you can treat a far-off city as a single point. With it a 2-trillion-particle universe was run on the Swiss machine Piz Daint in under 80 hours.
GPU-accelerated N-body code using the fast multipole method with adaptive time steps, built for trillion-particle runs for galaxy surveys.
Ran a 2-trillion-particle simulation to z=0 on Piz Daint in under 80 hours using 4000+ GPU nodes, and benchmarked 8 trillion on Titan.
Image: Ricarte et al. 2021, via Center for Astrophysics | Harvard & Smithsonian: ROMULUS galaxy with its central and "wandering" supermassive black holes
Box
25 Mpc
Machine
Blue Waters
Romulus, a computer universe about 80 million light-years across, was built to follow giant black holes more faithfully. Instead of pinning each black hole to the centre of its galaxy, as many simulations do, it lets them form, drift, sink inward and feed on gas according to physical rules. The run used up to 100,000 processors on the Blue Waters supercomputer.
A 25 Mpc volume with new, physically motivated models for how supermassive black holes form, move and sink within galaxies, and accrete gas.
Romulus25 ran on up to 100,000 cores with good scaling.
Simulates
dark matter, gas, stars, black holes, galaxies
Method
tree, SPH
Code
ChaNGa
Box
25 Mpc on a side
Supercomputer
Blue Waters (NCSA)
Led by
Michael Tremmel, Michael Karcher, Fabio Governato, Marta Volonteri, Tom Quinn, Andrew Pontzen
Neutrinos are ghostly particles with a tiny mass that stream through space almost untouched. TianNu put them into a computer universe about 5.6 billion light-years across alongside dark matter, with nearly 3 trillion particles in all, using most of China's Tianhe-2 supercomputer. It showed that neutrinos gather around clumps of dark matter unevenly, more in some surroundings than others.
A 2.97-trillion-particle run of cold dark matter plus 50 meV neutrinos on Tianhe-2 that revealed differential neutrino condensation onto haloes.
Rainy, cooler weather in Guangzhou seemed to coincide with better Tianhe-2 stability during the run, the authors noted.
Simulates
dark matter, neutrinos, large-scale structure
Method
N-body, P3M
Code
CUBEP3M
Box
1,200 Mpc/h on a side
Particles
69123 CDM + 138243 neutrinos (2.97 trillion)
Supercomputer
Tianhe-2, Guangzhou (13,824 compute nodes, 86% of the machine)
Led by
J. D. Emberson, Hao-Ran Yu, Derek Inman, Tong-Jie Zhang, Ue-Li Pen
Institutions
National Supercomputer Center in Guangzhou (Tianhe-2)
A test of new recipes for how exploding stars and feeding black holes heat and push gas. The FABLE team built on Illustris and checked their recipes against both a small universe about 190 million light-years across and detailed regrowths of galaxy groups and clusters. Matching real clusters' X-ray glow and mass hinted that astronomers may underestimate cluster masses measured from X-rays.
Feedback Acting on Baryons in Large-scale Environments: an Illustris-based AREPO model with revised AGN and supernova feedback, tested on a 40 Mpc/h box and zoom-ins of groups and clusters.
Comparing X-ray and lensing mass relations hinted at a non-negligible X-ray hydrostatic mass bias in observed cluster samples.
Simulates
dark matter, gas, stars, black holes, galaxies, clusters
Method
moving mesh
Code
AREPO
Box
40 Mpc/h on a side
Particles
Volume: 5123 DM + ~5123 baryonic elements; plus zoom-ins of groups and clusters drawn from Millennium-XXL
Mass resolution
DM 3.4×10⁷ M☉/h; baryonic 6.4×10⁶ M☉/h
Runs to
today (redshift 0)
Supercomputer
DiRAC Data Analytic system (Cambridge) and COSMA Data Centric system (Durham)
Led by
Nicholas A. Henden, Ewald Puchwein, Sijing Shen, Debora Sijacki
Part of FIRE (Feedback In Realistic Environments), FIRE-1
Image: Hopkins et al. 2017, arXiv:1702.06148, Fig. 2
Machine
Pleiades, Stampede, Comet
FIRE's second version keeps its central idea, that the push of starlight and exploding stars comes from the stars the simulation actually forms, and rebuilds the numerical methods underneath. Its authors reran the same galaxies with different numerical choices to see which results were real physics and which were artefacts of the method. They also published all their starting conditions and algorithms.
An updated FIRE code with more accurate numerics, used to test which galaxy properties depend on physics and which on numerical choices.
The FIRE-2 paper released all initial conditions and numerical algorithms used.
Simulates
dark matter, gas, stars, radiation, magnetic fields, galaxies, dwarf galaxies, Milky Way analogues
Method
TreePM, meshless
Code
GIZMO
Runs to
today (redshift 0)
Supercomputer
XSEDE Stampede, Comet; NASA Pleiades
Led by
Philip F. Hopkins, Andrew Wetzel, Dusan Keres, Claude-André Faucher-Giguère, Eliot Quataert
Three volumes (TNG50, TNG100, TNG300), each at three or four resolutions, with dark-matter-only twins; flagship runs exceed 20, 10 and 30 billion resolution elements
Machine
Hazel Hen
The Next Generation of the Illustris project: three computer universes of different sizes, from about 170 million to a billion light-years across, filled with dark matter, gas, stars, black holes and magnetic fields. The same physics runs at every size, so small detailed galaxies and huge rare clusters can be studied together. Its data were released publicly in 2019.
The successor to Illustris: three magnetohydrodynamic volumes of about 50, 100 and 300 Mpc run with an updated galaxy formation model that adds cosmic magnetic fields and kinetic black hole feedback.
The model parameters stay unchanged across resolutions that differ in mass by more than a factor of 10,000.
Simulates
dark matter, gas, stars, black holes, magnetic fields, galaxies, clusters, large-scale structure
Method
moving mesh, TreePM
Code
AREPO
Particles
Three volumes (TNG50, TNG100, TNG300), each at three or four resolutions, with dark-matter-only twins; flagship runs exceed 20, 10 and 30 billion resolution elements
Runs to
today (redshift 0)
Supercomputer
Hazel Hen (Cray XC40), HLRS Stuttgart (GCS projects GCS-ILLU and GCS-DWAR); MPCDF machines, Garching
Compute
TNG100/TNG300: 35 million core hours on 24,000 Hazel Hen cores (HLRS); TNG50: more than 130 million processor hours
Led by
Volker Springel, Annalisa Pillepich, Dylan Nelson, Lars Hernquist, Mark Vogelsberger
Institutions
HITS (Heidelberg), MPA Garching, MPIA Heidelberg, MIT, Harvard, Flatiron Institute CCA
A small computer universe, about 33 million light-years across, of the first billion years, when starlight was clearing the hydrogen fog that filled space. It follows the light itself as it escapes from thousands of young galaxies. A key finding: with pairs of stars orbiting each other included, enough light got out to clear the fog in time; with single stars only, it did not.
Radiation-hydrodynamics simulations of the first billion years that capture both large-scale reionization and ionizing light escaping from thousands of resolved galaxies.
With binary stars included the boxes were 99.9 per cent ionized by redshift 7; with single stars only they failed to reionize by redshift 6.
Simulates
dark matter, gas, stars, radiation, reionization, galaxies
Method
AMR, radiative transfer
Code
RAMSES-RT
Box
10 cMpc on a side
Mass resolution
better than about 10 pc in the interstellar medium
Supercomputer
SuperMUC (PRACE, Garching); later runs also on Juwels, Occigen and Joliot-Curie
Compute
PRACE provided 100 million CPU-hours (project site)
Led by
Joakim Rosdahl, Harley Katz, Jeremy Blaizot, Taysun Kimm, Leo Michel-Dansac
324 cluster resimulations from the MDPL2 run (38403 dark matter particles)
Machine
MareNostrum
Three hundred and twenty-four of the heaviest galaxy clusters, picked from a dark matter universe about 4.7 billion light-years across and regrown with gas and stars. Each regrowth covers a sphere about 140 million light-years wide, enough to include the cluster's surroundings. The same clusters were also run through simpler galaxy models, so different methods could be compared side by side.
Full-physics resimulations of 324 massive galaxy clusters drawn from the 1 Gpc/h MultiDark Planck 2 volume, each within a region of radius 15 Mpc/h.
The same clusters were also modelled with three semi-analytic galaxy models for side-by-side comparison.
Simulates
dark matter, gas, stars, black holes, clusters
Method
SPH
Box
1,000 Mpc/h on a side
Particles
324 cluster resimulations from the MDPL2 run (38403 dark matter particles)
Mass resolution
parent MDPL2 DM particle 1.5×10⁹ M☉/h
Runs to
today (redshift 0)
Supercomputer
MareNostrum, Barcelona Supercomputing Center (BSC-CNS)
Led by
Weiguang Cui, Alexander Knebe, Gustavo Yepes, Frazer Pearce, Chris Power, Romeel Davé
The middle-sized box of the TNG project, a cube about 360 million light-years across. It starts from exactly the same initial ripples as the original Illustris simulation, so the same galaxies form in the same places in both. That makes it a fair test: any difference between a galaxy and its older twin comes from the improved physics, not from chance.
The middle TNG volume, run from the same initial conditions as the original Illustris so the old and new galaxy formation models can be compared object by object.
Because TNG100 and Illustris share initial phases, the same individual galaxies form in the same places in both runs.
Simulates
dark matter, gas, stars, black holes, magnetic fields, galaxies, large-scale structure
Method
moving mesh, TreePM
Code
AREPO
Box
110.7 Mpc on a side
Particles
TNG100-1: 18203 gas cells + 18203 DM particles
Mass resolution
TNG100-1: DM 7.5×10⁶ M☉; gas 1.4×10⁶ M☉
Runs to
today (redshift 0)
Supercomputer
Hazel Hen (Cray XC40), HLRS Stuttgart (GCS projects GCS-ILLU and GCS-DWAR); MPCDF machines, Garching
Led by
Volker Springel, Annalisa Pillepich, Dylan Nelson, Rainer Weinberger, Lars Hernquist, Mark Vogelsberger
Institutions
HITS (Heidelberg), MPA Garching, MPIA Heidelberg, MIT, Harvard, Flatiron Institute CCA
The largest box of the TNG project, a cube about a billion light-years across. It trades fine detail for size, so it holds rare giants, such as galaxy clusters weighing about a thousand trillion Suns, and enough galaxies to measure how they cluster across space. Its most massive cluster reaches just over that mark by the present day.
The largest TNG volume, about 300 Mpc across, built for galaxy clustering statistics and rare objects such as massive galaxy clusters.
Its most massive cluster reaches just over 10^15 solar masses by the present day.
Simulates
dark matter, gas, stars, black holes, magnetic fields, galaxies, clusters, large-scale structure
Method
moving mesh, TreePM
Code
AREPO
Box
302.6 Mpc on a side
Particles
TNG300-1: 25003 gas cells + 25003 DM particles (more than 30 billion resolution elements)
Mass resolution
TNG300-1: DM 5.9×10⁷ M☉; gas 1.1×10⁷ M☉
Runs to
today (redshift 0)
Supercomputer
Hazel Hen (Cray XC40), HLRS Stuttgart (GCS projects GCS-ILLU and GCS-DWAR); MPCDF machines, Garching
Led by
Volker Springel, Annalisa Pillepich, Dylan Nelson, Lars Hernquist, Mark Vogelsberger
Institutions
HITS (Heidelberg), MPA Garching, MPIA Heidelberg, MIT, Harvard, Flatiron Institute CCA
Image: Aemulus Project website; no image credit stated
Box
1,050 Mpc/h
Seventy-five computer universes, each a cube about 4.9 billion light-years across, run with 47 different versions of the cosmos. They form a training set: from them, an emulator learns to predict how dark matter clumps and galaxies cluster for any version in between, without running a new simulation each time. The results agree to about 1 per cent for well-resolved clumps.
75 boxes of 1.05 Gpc/h in 47 wCDM cosmologies, the training set for emulators of halo and galaxy clustering.
Statistics converge to 1 per cent for haloes with more than 500 particles.
Simulates
dark matter, large-scale structure
Method
N-body
Box
1,050 Mpc/h on a side
Mass resolution
3.51×10¹⁰ (Ωm/0.3) M☉/h
Runs to
today (redshift 0)
Led by
Joseph DeRose, Risa H. Wechsler, Jeremy L. Tinker, Matthew R. Becker, Yao-Yuan Mao
Image: S. He et al./Proceedings of the National Academy of Sciences 2019, via Simons Foundation (Flatiron Institute): D3M (left) vs 2LPT (right), colour showing displacement error
A neural network, the kind of software behind image recognition, trained to do a simulation's job. After learning from 8,000 computer universes, it turned a smooth early universe into the clumpy web of dark matter in milliseconds, and still worked for amounts of dark matter it had never been shown. It was billed as the first AI simulation of the universe.
Deep neural network that predicts nonlinear structure formation from linear theory; billed as the first AI simulation of the universe.
Trained on 8,000 simulations, it ran in milliseconds and still worked for dark matter amounts it never saw in training.
Flatiron Institute Center for Computational Astrophysics, UC Berkeley Center for Cosmological Physics, Kavli IPMU, University of British Columbia, Carnegie Mellon University
Image: YITP (Kyoto University), via NAOJ press release: a virtual Universe from the Dark Quest runs on ATERUI II (~10 billion particles, ~4.9 billion light-years across)
Particles
8.6 × 10⁹
Machine
NAOJ Cray XC
Japan's national observatory ran 101 dark matter universes, each with its own version of the cosmos. They train Dark Emulator, a program that predicts in a few seconds on an ordinary computer how dark matter clumps cluster and bend light. Survey teams use it to compare their measurements with theory far faster than running new simulations.
Runs for 101 flat wCDM models used to train Dark Emulator, which predicts halo clustering and lensing statistics in a few CPU seconds.
The emulator predicts the halo-matter cross-correlation to better than 2 per cent for SDSS CMASS-like haloes.
Simulates
dark matter, dark energy, large-scale structure
Method
N-body, TreePM
Code
Gadget2
Particles
20483 per run, 101 wCDM models
Runs to
today (redshift 0)
Supercomputer
Cray XC30 and XC50, Center for Computational Astrophysics, NAOJ
Led by
Takahiro Nishimichi, Masahiro Takada, Ryuichi Takahashi, Ken Osato, Masato Shirasaki
Image: Garrison-Kimmel et al. 2018, arXiv:1806.04143, Fig. 1
Machine
Wheeler (Caltech)
Pairs of galaxies like the Milky Way and Andromeda, along with lone hosts for comparison, ten systems in all, grown in detail with FIRE physics. The aim was to see whether the standard picture predicts the right number and density of small dwarf galaxies around them. The runs suggest about three faint dwarfs near the Milky Way are still waiting to be found.
FIRE-2 zooms of Milky Way and Andromeda-like pairs and isolated hosts, ten host systems in all, used to test dwarf galaxy counts and densities.
The runs predict about three undiscovered dwarf galaxies of about 10^5 solar masses within 300 kpc of the Milky Way.
Simulates
dark matter, gas, stars, Milky Way analogues, dwarf galaxies
Method
meshless
Code
GIZMO (FIRE-2)
Mass resolution
baryonic particle mass about 3,500 to 7,000 M☉
Runs to
today (redshift 0)
Supercomputer
Caltech cluster 'Wheeler'; XSEDE and NASA HEC allocations
Led by
Shea Garrison-Kimmel, Philip F. Hopkins, Andrew Wetzel, James S. Bullock, Michael Boylan-Kolchin
Image: Heitmann et al. 2019, arXiv:1904.11970, Fig. 1
Box
3,000 Mpc/h
Particles
1.1 × 10¹²
Machine
Mira
A dark matter universe with about a trillion particles in a cube roughly 14 billion light-years across, run on Argonne's Mira supercomputer. It produced more than 5 petabytes of data, the equivalent of over a million DVDs. Its fake skies were used by the teams behind DESI, eBOSS, cosmic microwave background experiments and the Rubin Observatory to test their analyses.
A trillion-particle run in a 4.2 Gpc box on Mira whose synthetic catalogues fed DESI, eBOSS, CMB experiments and the LSST DESC data challenges.
The full data set produced by the simulation totals more than 5 PB.
Simulates
dark matter, large-scale structure
Method
N-body
Code
HACC
Box
3,000 Mpc/h on a side
Particles
102403 (1.07 trillion)
Mass resolution
1.85×10⁹ M☉/h
Runs to
today (redshift 0)
Supercomputer
Mira, IBM Blue Gene/Q, Argonne Leadership Computing Facility
Led by
Katrin Heitmann, Hal Finkel, Adrian Pope, Vitali Morozov, Nicholas Frontiere, Salman Habib
Image: Tremmel et al. 2018, arXiv:1806.01282, Fig. 1 panel
Machine
Blue Waters
A single galaxy cluster, about a hundred trillion times the mass of the Sun, grown in the same fine detail as the Romulus25 universe. At the time it was the most detailed simulation of a cluster in a cosmological setting. It showed that the cluster stops star formation even in small dwarf galaxies, and that this effect reaches beyond the cluster's edge.
A zoom simulation of a 10^14 solar-mass galaxy cluster at Romulus25 resolution, then the highest-resolution cosmological cluster simulation.
Cluster galaxies are quenched down to dwarf masses, and the effect already extends beyond the cluster virial radius.
Simulates
dark matter, gas, stars, black holes, clusters, galaxies
Method
tree, SPH
Code
ChaNGa
Runs to
today (redshift 0)
Supercomputer
Blue Waters (NCSA)
Led by
Michael Tremmel, Thomas R. Quinn, Angelo Ricarte, Arif Babul, Urmila Chadayammuri, Priyamvada Natarajan
Image: Davé et al. 2019, arXiv:1901.10203, Fig. 2 panel
Box
100 Mpc/h
Particles
10243 gas elements
Machine
DiRAC
The successor to MUFASA: a computer universe about 470 million light-years across in which galaxies, black holes and even dust grow together. Its black holes fire jets at about 8,000 kilometres per second, and those jets turn out to be what shuts down star formation in the most massive galaxies. Dust is created and destroyed as the simulation runs.
The successor to MUFASA, adding torque-limited black hole growth, jet feedback and on-the-fly dust to a 100 Mpc/h volume.
Its black hole jets reach about 8000 km/s at low Eddington ratios and are mainly responsible for quenching massive galaxies.
Simulates
dark matter, gas, stars, black holes, dust, galaxies
Method
meshless
Code
GIZMO (meshless finite mass)
Box
100 Mpc/h on a side
Particles
10243 gas elements
Runs to
today (redshift 0)
Supercomputer
DiRAC@Durham
Led by
Romeel Davé, Daniel Anglés-Alcázar, Desika Narayanan, Qi Li, Mika H. Rafieferantsoa
The smallest and most detailed box of the TNG project, a cube about 170 million light-years across. It is large enough to hold around a hundred galaxies like our Milky Way and one cluster like Virgo, yet sharp enough to see the gas where stars form, about 300 to 450 light-years across. That lets researchers watch winds blown out of galaxies by exploding stars and black holes.
The highest-resolution TNG volume, a 51.7 Mpc box that reaches zoom-simulation detail while still holding about 100 Milky Way-mass galaxies and one Virgo-like cluster.
Star-forming gas is resolved at about 100 to 140 parsecs across cosmic time, per the TNG project description.
Simulates
dark matter, gas, stars, black holes, magnetic fields, galaxies, Milky Way analogues
Method
moving mesh, TreePM
Code
AREPO
Box
51.7 Mpc on a side
Particles
TNG50-1: 21603 gas cells + 21603 DM particles (more than 20 billion resolution elements)
Mass resolution
TNG50-1: DM 4.5×10⁵ M☉; gas 8.5×10⁴ M☉
Runs to
today (redshift 0)
Supercomputer
Hazel Hen (Cray XC40), HLRS Stuttgart
Compute
More than 130 million processor hours on 16,320 cores, running for more than a year
Part of EAGLE (Evolution and Assembly of GaLaxies and their Environments)
Image: Font et al. 2020, arXiv:2004.01914, Fig. 1
Machine
DiRAC
Forty-two virtual galaxies about the size of our Milky Way, each grown from the early Universe with gas, stars and dark matter. The team zoomed in on the faint haze of old stars that surrounds such galaxies, much of it the wreckage of smaller galaxies swallowed long ago. Their question was how that halo of stars records a galaxy's eating history.
Forty-two high-resolution zooms of Milky Way-mass haloes run with the EAGLE code, used to study the faint stellar haloes around such galaxies.
Stellar halo density profiles break at roughly 20 to 40 kpc, marking the switch from stars born in place to accreted stars.
Simulates
dark matter, gas, stars, galaxies, Milky Way analogues
Image: Ocvirk et al. 2018, arXiv:1811.11192, Fig. 1
Box
94 Mpc
Particles
6.9 × 10¹⁰
Machine
Titan
A model of our own corner of the cosmos at its dawn, when the light of the first galaxies stripped electrons from the hydrogen filling space, a change called reionization. The simulated region, about 300 million light-years across, was set up to grow into the real Local Universe. It found that the Milky Way and Andromeda each cleared their own bubble of gas, rather than being lit up by a neighbour.
A recalibrated successor to CoDa I that ends reionization near redshift 6 and resolves every halo above 10^8 solar masses in a constrained Local Universe.
The Milky Way and M31 reionized as separate islands, not by the Virgo progenitor or by each other.
Simulates
dark matter, gas, stars, radiation, reionization, galaxies
Method
AMR, radiative transfer
Code
RAMSES-CUDATON
Box
94 Mpc on a side
Particles
40963 particles and cells
Supercomputer
Titan, Oak Ridge Leadership Computing Facility
Led by
Pierre Ocvirk, Dominique Aubert, Jenny G. Sorce, Paul R. Shapiro, Nicolas Deparis
Image: Credit: University of Surrey, Matt Orkney, Andrew Pontzen and Ethan Taylor
Machine
DiRAC
Tiny, faint galaxies are the hardest test of any theory, because a few exploding stars can blow out much of their gas. EDGE grows these dwarfs in a computer from the early Universe to today, with detail down to about ten light-years, to see which physics survives contact with real ones. Only the amount of heavy elements in their stars told the competing models apart.
Zoom simulations of the faintest dwarf galaxies, run to the present day at a few parsecs resolution to test galaxy formation physics at its limit.
Only the stellar mass-metallicity relation separated the different feedback models; sizes and velocities could not.
Simulates
dark matter, gas, stars, radiation, dwarf galaxies
Method
AMR, radiative transfer
Code
RAMSES
Mass resolution
about 20 M☉ and about 3 pc
Runs to
today (redshift 0)
Supercomputer
DiRAC Data Intensive service, Leicester
Led by
Oscar Agertz, Andrew Pontzen, Justin I. Read, Martin P. Rey, Matthew Orkney
Image: Chabanier et al. 2020, arXiv:2007.04624, Fig. 6
Box
50 Mpc/h
Machine
Joliot-Curie, Curie
Galaxies are fed by streams of cold gas falling in from the thin space between them, and most simulations draw that space coarsely. Extreme-Horizon, a computer universe some 230 million light-years across, kept fine detail there too. Better-drawn streams changed how gas reached young galaxies, and the run grew very compact, massive galaxies through many small mergers.
A galaxy-formation volume that keeps unusually fine resolution in the thin gas between galaxies, which changes how cold gas flows feed them.
It formed ultracompact massive galaxies at redshift 2 through repeated mergers of small progenitors.
Simulates
dark matter, gas, stars, black holes, galaxies
Method
AMR
Code
RAMSES
Box
50 Mpc/h on a side
Supercomputer
Joliot-Curie (AMD-Rome partition, 25,000 cores), TGCC, France
Image: Libeskind et al. 2020, arXiv:2008.04926, Fig. 2
Particles
Constrained Local Group zooms; high-resolution region 3-5 Mpc in radius around the Local Group midpoint
Our own corner of the universe, copied into a computer. Its starting conditions were worked out from how nearby galaxies actually move, so a Milky Way and Andromeda pair forms with the right neighbours around it. The detailed region reaches about 10 to 16 million light-years from the pair's midpoint, and in some runs a companion like the Large Magellanic Cloud appears.
Constrained simulations of the Local Group whose initial conditions reproduce nearby galaxy motions, so a Milky Way and Andromeda pair forms in its real cosmic surroundings.
In some runs a Magellanic Cloud-like object forms alongside the Milky Way analogue.
Simulates
dark matter, gas, stars, magnetic fields, Milky Way analogues, galaxies, dwarf galaxies
Method
moving mesh
Code
AREPO
Particles
Constrained Local Group zooms; high-resolution region 3-5 Mpc in radius around the Local Group midpoint
Runs to
today (redshift 0)
Led by
Noam I. Libeskind, Edoardo Carlesi, Robert J. J. Grand, Arman Khalatyan, Alexander Knebe
Image: Villaescusa-Navarro et al. 2020, ApJS 250, 2, arXiv:1909.05273, Fig. 2 (top row): projected matter density in 500 x 500 x 10 (Mpc/h)^3 regions of two high-resolution Latin-hypercube Quijote runs at z = 0 (Planck-like cosmology at left); panels Image663.png + Image95.png, colour bars and axes trimmed
Box
1,000 Mpc/h
Particles
8.5 × 10¹²
Forty-four thousand computer universes, each a cube of space nearly five billion light-years on a side, run with more than 7,000 slightly different versions of the cosmos. By comparing them, cosmologists can ask how much a given map of galaxies can really tell us about what the Universe is made of. The collection also became a training ground for machine-learning tools that read cosmic structure.
44,100 gigaparsec boxes spanning over 7,000 cosmologies, built to measure the information in cosmological observables and to train machine learning.
The public release is about a petabyte, with hundreds of thousands of snapshots.
Simulates
dark matter, neutrinos, large-scale structure
Method
N-body, TreePM
Code
Gadget-III
Box
1,000 Mpc/h on a side
Particles
44,100 runs of 2563, 5123 or 10243; over 8.5 trillion in total
Runs to
today (redshift 0)
Compute
more than 35 million core hours
Led by
Francisco Villaescusa-Navarro, ChangHoon Hahn, Elena Massara, Arka Banerjee
Institutions
Flatiron Institute Center for Computational Astrophysics, Princeton University
Abacus works out how trillions of particles of matter pull on each other under gravity, written to be both very fast and very exact. Nearby particles are added up one by one; distant ones are handled in bulk with a clever shortcut. On the Summit supercomputer it built AbacusSummit, a 60-trillion-particle library of universes for galaxy surveys.
N-body code that splits near-field forces (direct summation) from far-field forces (a static multipole mesh), reaching a median force error of 10^-5.
Produced AbacusSummit, 60 trillion particles in total, on the Summit supercomputer at about 70 million particle updates per second per node.
Simulates
dark matter, large-scale structure
Method
N-body
Supercomputer
Summit (Oak Ridge Leadership Computing Facility)
Led by
Lehman H. Garrison, Daniel J. Eisenstein, Douglas Ferrer, Nina A. Maksimova, Philip A. Pinto
Image: Maksimova et al. 2021, arXiv:2110.11398, Fig. 1; image by Lehman Garrison (as labelled in the figure)
Box
2,000 Mpc/h
Particles
6.0 × 10¹³
Machine
Summit
A public library of computer universes made for DESI, the instrument now measuring distances to tens of millions of galaxies. Its main boxes are cubes over nine billion light-years on a side, run across 97 different versions of cosmology, some 60 trillion particles in all. Nearly two thousand smaller boxes were added just to measure how much results scatter by chance.
A public suite of about 60 trillion particles across 97 cosmologies, built for DESI with very high force accuracy on Summit.
A sub-suite of 1883 boxes of 500 Mpc/h side was run just for covariance estimation.
Simulates
dark matter, large-scale structure
Method
N-body
Code
Abacus
Box
2,000 Mpc/h on a side
Particles
≈60 trillion in total; base boxes 69123 (≈330 billion) each
Mass resolution
2×10⁹ M☉/h
Runs to
redshift 0.1
Supercomputer
Summit, Oak Ridge Leadership Computing Facility
Compute
≈250,000 node-hours for the 139 base boxes (paper table)
Led by
Nina A. Maksimova, Lehman H. Garrison, Daniel J. Eisenstein, Boryana Hadzhiyska, Sownak Bose
Image: Angulo et al. 2020, arXiv:2004.06245, Fig. 1
Box
1,440 Mpc/h
Particles
8.1 × 10¹⁰
Machine
MareNostrum
Running a giant simulation for every possible version of the Universe is impossible, so the BACCO team ran three very large ones and stretched them. A rescaling trick lets each run stand in for many cosmologies, covering 800 combinations of eight cosmic settings. The result is a public emulator, a fast stand-in that predicts in moments how clumpy matter should be.
A few large 4320^3 runs plus cosmology rescaling, turned into a public emulator of the nonlinear matter power spectrum across 8 parameters.
Rescaling lets three main simulations stand in for 800 points in an 8-dimensional parameter space.
Simulates
dark matter, large-scale structure
Method
N-body, TreePM
Code
L-Gadget3
Box
1,440 Mpc/h on a side
Particles
43203 per main run
Mass resolution
3.7×10⁹ M☉/h (Narya)
Runs to
today (redshift 0)
Supercomputer
MareNostrum, Barcelona Supercomputing Center
Led by
Raul E. Angulo, Matteo Zennaro, Sergio Contreras, Giovanni Aricò, Marcos Pellejero-Ibañez, Jens Stücker
Institutions
Donostia International Physics Center (DIPC), Barcelona Supercomputing Center
Image: Villaescusa-Navarro et al. 2020, arXiv:2010.00619, Fig. 1
Box
25 Mpc/h
Particles
16,960 simulations as of June 2026 (7,208 N-body, 9,752 hydrodynamic)
Nearly seventeen thousand small computer universes, each a cube about 120 million light-years across, made with ten different combinations of code and galaxy physics. In each one the team turned the dials a little: how much matter there is, how hard exploding stars and black holes push gas around. The aim is to teach machine-learning tools to read the real Universe's settings from what telescopes see.
Thousands of small simulations that vary cosmological and feedback parameters around models such as IllustrisTNG, built to train machine-learning tools for cosmological inference.
The suite totals more than 2 petabytes across nearly 17,000 runs and ten code and model combinations.
Simulates
dark matter, gas, stars, black holes, galaxies, large-scale structure
Image: not stated (GADGET-4 website banner, 1024×140 px)
Method
N-body, TreePM, FMM
GADGET-4 rebuilds one of the most widely used programs for making universes in a computer. It calculates how billions of particles pull on each other and how gas flows between them, then finds the clumps that form and records how they merge over time. Volker Springel's team rewrote it to run faster and more accurately on modern supercomputers, and released it publicly.
Public rewrite of GADGET with better force accuracy, hierarchical time-stepping, hybrid MPI and shared-memory parallelism, and built-in halo finding and merger trees.
Ships with its own second-order Lagrangian initial-conditions generator and can use a momentum-conserving fast multipole method instead of TreePM.
Simulates
dark matter, gas, stars, large-scale structure
Method
N-body, TreePM, FMM, SPH
Led by
Volker Springel, Rüdiger Pakmor, Oliver Zier, Martin Reinecke
Image: Heitmann et al. 2020, arXiv:2006.01697, Fig. 1
Box
3,400 Mpc/h
Particles
1.2 × 10¹²
Machine
Mira
The last job to fill the whole of Argonne's Mira supercomputer before it was retired: 1.24 trillion particles of dark matter in a cube about 16 billion light-years across. As it ran, it recorded the sky an observer would see looking outward and back in time, the raw material for mock galaxy surveys. It also tried a new way of tracking the smaller clumps inside larger ones.
A gravity-only run of 1.24 trillion particles in a 5 Gpc box, the final full-machine job on Argonne's Mira, with lightcones built in situ.
It introduced subhalo cores, a new in-situ way of tracking halo substructure.
Simulates
dark matter, large-scale structure
Method
N-body
Code
HACC
Box
3,400 Mpc/h on a side
Particles
107523 (≈1.24 trillion)
Runs to
today (redshift 0)
Supercomputer
Mira, IBM Blue Gene/Q, Argonne Leadership Computing Facility
Led by
Katrin Heitmann, Nicholas Frontiere, Esteban Rangel, Patricia Larsen, Adrian Pope, Salman Habib
40963 effective resolution in the high-resolution patch
NewHorizon zooms into one region of a larger simulated universe, Horizon-AGN: a ball of space about 33 million light-years in radius, drawn with detail down to about 110 light-years. At that sharpness, star formation inside many galaxies at once appears clumpy and turbulent, as it is in real ones. French, Korean and British teams ran it.
A zoom of a (16 Mpc)^3 region inside Horizon-AGN that reaches 34 pc resolution, capturing clumpy, turbulent star formation in many galaxies at once.
Its high-resolution region is a sphere of 10 Mpc radius cut from the 100 Mpc/h Horizon-AGN box.
Simulates
dark matter, gas, stars, black holes, galaxies
Method
AMR
Code
RAMSES
Box
16 Mpc on a side
Particles
40963 effective resolution in the high-resolution patch
Image: Trebitsch et al. 2020, arXiv:2002.04045, Fig. 1
Machine
Joliot-Curie, Curie
A young, crowded region of space, destined to become a galaxy cluster, followed through the Universe's first two billion years with its light as well as its gas. The question was who cleared the fog of neutral hydrogen that filled early space: ordinary stars in galaxies, or bright feeding black holes called quasars. In this busy patch, the galaxies did most of the work.
A radiation-hydrodynamics zoom on a protocluster drawn from Horizon-AGN, following its first two billion years to separate the roles of stars and quasars in reionization.
In this overdense region galaxies, not accreting black holes, drove hydrogen reionization, finished by about redshift 6.
Simulates
dark matter, gas, stars, black holes, radiation, reionization, clusters
Method
AMR, radiative transfer
Code
RAMSES
Runs to
redshift 3.5
Supercomputer
Joliot-Curie (GENCI@CEA, France), via PRACE
Led by
Maxime Trebitsch, Yohan Dubois, Marta Volonteri, Hugo Pfister, Corentin Cadiou
Image: Ishiyama et al. 2020, arXiv:2007.14720, Fig. 2
Box
140 Mpc/h
Particles
2.6 × 10¹¹
Machine
K computer, ATERUI II
The sharp-eyed little sibling of Uchuu: a smaller cube of space, about 650 million light-years across, filled with 262 billion particles of dark matter. Each particle is hundreds of times lighter than in its parent, so it can see the small clumps of dark matter that cradle dwarf galaxies. Together the two runs cover giant clusters down to tiny hosts.
The highest-resolution member of the Uchuu suite: 262 billion particles in a 140 Mpc/h box, resolving haloes that host dwarf galaxies.
Each Shin-Uchuu particle weighs under a million solar masses per h, about 365 times lighter than in Uchuu.
Simulates
dark matter, dwarf galaxies
Method
N-body, TreePM
Code
GreeM
Box
140 Mpc/h on a side
Particles
64003 (262 billion)
Mass resolution
8.97×10⁵ M☉/h
Runs to
today (redshift 0)
Supercomputer
ATERUI II, NAOJ; K computer, RIKEN (suite)
Led by
Tomoaki Ishiyama, Francisco Prada, Anatoly A. Klypin
Institutions
Chiba University, NAOJ Center for Computational Astrophysics, RIKEN
Image: Dávid Guszejnov, Mike Grudić, and the STARFORGE Project
Machine
Frontera
Not a universe but a single nursery of stars: a cold cloud of gas and dust about twenty thousand times the Sun's mass, collapsing under its own weight. STARFORGE follows every individual star as it forms, along with the jets, light, winds and explosions that push back on the cloud. Its first full run was nicknamed the Anvil of Creation.
Radiation-magnetohydrodynamics simulations of giant molecular clouds that follow individual stars forming and their jets, radiation, winds and supernovae. Not cosmological.
Its first full run followed a 20,000 solar-mass cloud, nicknamed the Anvil of Creation, with all major feedback acting together.
Simulates
gas, stars, magnetic fields, radiation
Method
meshless, radiative transfer
Code
GIZMO (MFM MHD)
Supercomputer
Frontera, Texas Advanced Computing Center
Compute
methods-paper test runs roughly 104 to 105 core-hours
Led by
Michael Y. Grudić, Dávid Guszejnov, Philip F. Hopkins, Stella S. R. Offner, Claude-André Faucher-Giguère
A vast computer universe of 2.1 trillion particles of dark matter, the invisible mass that outweighs ordinary matter about five to one. Its cube is more than nine billion light-years on a side, yet fine enough to follow clumps from those hosting small galaxies up to giant clusters. Uchuu, Japanese for outer space, was built by Japanese and Spanish teams and made openly available.
A 2.1-trillion-particle box 2 Gpc/h across that follows haloes from dwarf hosts to massive clusters, with public data on the Skies and Universes site.
Its mass-concentration model fits haloes spanning nearly eight orders of magnitude in mass at redshifts 0 to 14 within 5 per cent.
Simulates
dark matter, large-scale structure, clusters
Method
N-body, TreePM
Code
GreeM
Box
2,000 Mpc/h on a side
Particles
128003 (2.1 trillion)
Mass resolution
3.27×10⁸ M☉/h
Runs to
today (redshift 0)
Supercomputer
ATERUI II, Center for Computational Astrophysics, NAOJ; K computer, RIKEN (suite)
Led by
Tomoaki Ishiyama, Francisco Prada, Anatoly A. Klypin
Institutions
Chiba University, NAOJ Center for Computational Astrophysics, RIKEN, Instituto de Astrofísica de Andalucía (CSIC)
Young galaxies and their black holes are the focus of ASTRID, a computer universe about 1.2 billion light-years across. Gas, stars, ghostly neutrinos and the uneven lighting-up of early space are all included, and black holes have to sink and find each other before they merge. Before the Universe was about 2.2 billion years old, ASTRID had counted some 450,000 black hole mergers.
A 250 Mpc/h volume focused on the early universe, with patchy reionization, massive neutrinos and black holes that merge through dynamical friction.
ASTRID recorded about 450,000 black hole mergers before redshift 3.
Simulates
dark matter, gas, stars, black holes, neutrinos, reionization, galaxies
Image: P. Ocvirk, D. Aubert, J. Lewis, N. Gillet, J. Chardin (Observatoire astronomique de Strasbourg): 8 cMpc/h sub-region of CoDa III at z=7.3 (white gas density, blue ionizing photons, red hot gas)
Box
94 cMpc
Particles
81923 grid
Machine
Summit
The third Cosmic Dawn run, a model of our own cosmic neighbourhood when the first galaxies were lighting up the hydrogen around them. With a grid of more than 500 billion cells across a region about 300 million light-years wide, it measured how far that early light could travel before being absorbed. It was described as the largest simulation of this era ever performed.
The third Cosmic Dawn run, with an 8192^3 grid, used to study how far ionizing photons travel through the intergalactic medium near redshift 6.
It was described as the largest reionization simulation and the largest RAMSES simulation ever performed.
Simulates
dark matter, gas, stars, radiation, reionization, galaxies
Method
AMR, radiative transfer
Code
RAMSES-CUDATON
Box
94 cMpc on a side
Particles
81923 grid
Supercomputer
Summit, Oak Ridge National Laboratory (131,072 processors and 24,576 GPUs)
Led by
Joseph S. W. Lewis, Pierre Ocvirk, Jenny G. Sorce, Yohan Dubois, Dominique Aubert
Image: Frontiere et al. 2021, arXiv:2109.01956, Fig. 3
Box
1,000 Mpc/h
Particles
1.9 × 10¹²
Machine
Summit
Nearly two trillion particles of dark matter in a cube about 4.7 billion light-years across, run on the GPU-powered Summit supercomputer at Oak Ridge. Farpoint gave up some volume to see finer detail, so that even small clumps of dark matter, the kind that host modest galaxies, show up across a huge stretch of space. That makes it a tool for linking galaxies to their invisible hosts.
Nearly two trillion particles in a 1 Gpc/h box on Summit, trading volume for mass resolution to study the galaxy-halo connection.
Its particle mass of about 4.6×10^7 Msun/h lets it capture low-mass haloes across a gigaparsec-scale volume.
Simulates
dark matter, large-scale structure
Method
N-body
Code
HACC
Box
1,000 Mpc/h on a side
Particles
close to two trillion
Mass resolution
≈4.6×10⁷ M☉/h
Runs to
today (redshift 0)
Supercomputer
Summit (GPU-accelerated), Oak Ridge Leadership Computing Facility
Led by
Nicholas Frontiere, Katrin Heitmann, Esteban Rangel, Patricia Larsen, Adrian Pope, Salman Habib
Image: Hernández-Aguayo et al. 2022, arXiv:2210.10059, Fig. 1
Box
3,000 Mpc
Particles
1.1 × 10¹²
Machine
SuperMUC-NG, COSMA8
The gravity-only companions to MillenniumTNG: runs that follow dark matter, the invisible mass that outweighs ordinary matter, and the ghostly particles called neutrinos. The flagship fills a cube nearly ten billion light-years on a side with 1.1 trillion particles. Paired runs with opposite starting ripples, a lump in one where the other has a hollow, cancel much of the chance scatter, sharpening predictions for galaxy surveys.
Fixed-and-paired dark-matter-only runs that accompany the MillenniumTNG hydro box, including a 1.1-trillion-particle flagship with massive neutrinos in a 3000 Mpc volume.
The flagship run follows 1.1 trillion dark matter particles plus massive neutrinos in a (3000 Mpc)^3 volume.
Simulates
dark matter, neutrinos, large-scale structure
Method
N-body, TreePM
Code
GADGET-4
Box
3,000 Mpc on a side
Particles
up to 43203 in 740 Mpc boxes; 1.1 trillion in the 3000 Mpc neutrino run
Image: McAlpine et al. 2022, arXiv:2202.04099, Fig. 18
Box
1,000 Mpc
Particles
1.3 × 10¹¹
Machine
COSMA7, DiRAC
SIBELIUS-DARK copies our actual neighbourhood out to about 650 million light-years, built so that its clusters and voids sit where the real ones do, with a Milky Way and Andromeda pair at the centre. The run follows dark matter, then a separate model paints galaxies on top. It suggests our surroundings hold unusually many giant clusters inside a slightly emptier-than-average region.
A constrained dark-matter-only realisation of the local volume to 200 Mpc from the Milky Way, embedding a Local Group-like system in its correct cosmic environment, with GALFORM galaxies.
Its galaxy and halo catalogues are public on VirgoDB (release McAlpine2022a). The local volume turns out to hold unusually many supermassive clusters within a roughly 5 per cent underdensity.
Simulates
dark matter, large-scale structure, galaxies
Method
N-body, semi-analytic
Code
SWIFT (N-body solver) + GALFORM
Box
1,000 Mpc on a side
Particles
50783 (131 billion)
Mass resolution
1.15×10⁷ M☉
Runs to
today (redshift 0)
Supercomputer
COSMA-7, DiRAC facility, Durham University (160 nodes, 4480 cores)
Led by
Stuart McAlpine, John C. Helly, Matthieu Schaller, Till Sawala, Guilhem Lavaux, Jens Jasche, Carlos S. Frenk, Adrian Jenkins
Named after the Etruscan goddess of the dawn, THESAN replays the era when the first galaxies lit up and their light stripped the cold hydrogen between them of its electrons, heating it and clearing the fog it formed, a change called reionization. Its region of space is about 300 million light-years across, and it tracks light and gas together, ending about a billion years after the Big Bang.
Radiation-magnetohydrodynamic simulations of a 95.5 Mpc volume that couple the IllustrisTNG galaxy model with on-the-fly radiative transfer to follow how early galaxies reionized the Universe.
Named after the Etruscan goddess of the dawn; the flagship run ends at redshift 5.5 with cells as small as 10 parsecs.
Simulates
dark matter, gas, stars, black holes, magnetic fields, radiation, dust, reionization, galaxies
Method
moving mesh, TreePM, radiative transfer
Code
AREPO-RT
Box
95.5 Mpc on a side
Particles
THESAN-1: 2 × 21003
Mass resolution
THESAN-1: DM 3.12×10⁶ M☉; gas 0.58×10⁶ M☉
Runs to
redshift 5.5
Supercomputer
SuperMUC-NG (LRZ, Garching; GCS)
Compute
Nearly 30 million CPU hours on almost 60,000 processors of SuperMUC-NG
Led by
Rahul Kannan, Enrico Garaldi, Aaron Smith, Mark Vogelsberger, Rüdiger Pakmor, Volker Springel, Lars Hernquist
Institutions
MIT, Harvard-Smithsonian CfA, MPA Garching, York University, Kavli IPMU
Image: Wang et al. 2022, arXiv:2206.06313, Fig. 2 right panel
Box
512 Mpc/h
Particles
2.1 × 10¹²
Some 2.1 trillion particles of dark matter in a cube about 2.4 billion light-years across, stopped deliberately when the Universe was roughly a billion years old. By then the first big clumps of dark matter had formed, and the team wanted to know how tightly packed they were. The surprise was that they turned out much looser than most models had predicted.
A 2.1-trillion-particle run stopped at redshift 5.5, when reionization had just finished, to study the first massive dark matter haloes.
It finds halo concentrations at z of 5.5 to 10 much lower than most models predict, with no upturn at high mass.
Image: Joe Insley, Silvio Rizzi and HACC Cosmology Code Team / Argonne National Laboratory (via OLCF)
Method
N-body, SPH
HACC is a program built to follow trillions of particles of dark matter on the largest supercomputers. CRK-HACC adds ordinary gas to it, using a careful way of smoothing gas particles that keeps mass, momentum and energy exactly balanced. The goal is mock skies for the next big surveys that include how gas, and not only gravity, reshapes cosmic structure.
Extension of HACC that adds gas using Conservative Reproducing Kernel SPH, aimed at baryonic effects in synthetic skies for upcoming surveys.
CRKSPH kernels interpolate linear fields exactly while conserving mass, momentum and energy.
Simulates
dark matter, gas, large-scale structure
Method
N-body, SPH
Led by
Nicholas Frontiere, J. D. Emberson, Michael Buehlmann, Joseph Adamo, Salman Habib
Part of FIRE (Feedback In Realistic Environments), FIRE-1
Image: BonFIRE/CampFIRE paper 2026, arXiv:2605.24104, Fig. 1: stellar, gas and dark matter density in a 5 cMpc slice of the BonFIRE volume (run with FIRE-3 physics) and CampFIRE zooms at three resolutions
FIRE is a set of rules for how stars are born, live and die inside simulated galaxies: how they heat and enrich their gas, how gas cools, which elements they make. The third version updates all of these and publishes them as formulas that other teams can drop into their own programs. It can also add cosmic rays and growing black holes.
The third version of the FIRE model, updating stellar evolution, yields, cooling and chemistry, with fitting functions others can plug into their own codes.
FIRE-3 adds optional spectrally resolved cosmic rays and supermassive black hole growth and feedback.
Simulates
gas, stars, black holes, cosmic rays, galaxies
Method
meshless
Code
GIZMO
Led by
Philip F. Hopkins, Andrew Wetzel, Coral Wheeler, Robyn Sanderson, Michael Y. Grudić
Image: FIRE project, FIREbox page; no image credit stated
Box
22.1 Mpc
Machine
MareNostrum, Frontera
Most simulations choose: a big patch of universe drawn coarsely, or a single galaxy drawn sharply. FIREbox does both, a cube about 72 million light-years across drawn with detail down to about 65 light-years. That gives around a thousand galaxies whose inner gas and star-forming clouds can actually be seen rather than averaged over.
A full cosmological box run at zoom-simulation resolution with FIRE physics, giving about a thousand galaxies with a resolved interstellar medium.
FIREbox spans a dynamic range of about a million, from 20 pc to 22.1 Mpc.
Simulates
dark matter, gas, stars, galaxies
Method
meshless
Code
GIZMO (FIRE-2)
Box
22.1 Mpc on a side
Mass resolution
baryon mass about 6×10⁴ M☉; about 20 pc
Runs to
today (redshift 0)
Supercomputer
TACC allocations incl. Frontera; NASA HEC; MareNostrum (BSC) via PRACE
Compute
about 5 million core hours; about 3 months wall-clock
Led by
Robert Feldmann, Eliot Quataert, Claude-André Faucher-Giguère, Philip F. Hopkins, Onur Çatmabacak
Image: Schaye et al. 2023, MNRAS 526, 4978 (Fig. 1)
Box
2,800 Mpc
Particles
3.0 × 10¹¹
Machine
COSMA8, DiRAC
FLAMINGO's computer universes are big enough to stand beside the largest galaxy surveys, the biggest a cube about nine billion light-years across, filled with gas, stars, black holes and ghostly neutrinos as well as dark matter. Its galaxy recipes were tuned with machine learning to match real observations. When published, its 300-billion-particle run was the largest of its kind carried through to the present day.
Gigaparsec hydrodynamical volumes with massive neutrinos and machine-learning-calibrated feedback, built to interpret large-scale structure and cluster surveys.
Its 2.8 Gpc run follows 300 billion particles, the largest hydrodynamical simulation run to redshift zero when published.
Simulates
dark matter, gas, stars, black holes, neutrinos, clusters, large-scale structure
Method
FMM, SPH
Code
SWIFT (SPHENIX SPH)
Box
2,800 Mpc on a side
Particles
Up to 3×10¹¹ (2×50403 + 28003) in L2p8_m9
Mass resolution
baryonic particle mass 1.3×10⁸ (m8), 1.1×10⁹ (m9), 8.6×10⁹ (m10) M☉
The famous Millennium universe, about 2.4 billion light-years across, built again with gas, stars, black holes and magnetic fields in place of dark matter alone. It uses the IllustrisTNG recipe for making galaxies and follows about 100 million of them. Matching dark-matter and neutrino runs extend it to the huge volumes that galaxy surveys of the 2020s are mapping.
Reruns the original 500 Mpc/h Millennium volume with the full IllustrisTNG physics, plus matching dark matter and massive-neutrino runs, for the large galaxy surveys of the 2020s.
The hydro box follows about 100 million galaxies, according to the Max Planck Society.
Simulates
dark matter, gas, stars, black holes, magnetic fields, neutrinos, galaxies, clusters, large-scale structure
Method
moving mesh, TreePM, N-body
Code
AREPO (hydrodynamic runs); GADGET-4 (dark matter and neutrino runs)
Box
500 Mpc/h on a side
Particles
MTNG740 hydro run: 2 × 43203 (80.6 billion cells); companion GADGET-4 runs up to 102403 DM + 25603 neutrino particles in 2040 Mpc/h
Mass resolution
MTNG740: baryonic 3.1×10⁷ M☉
Runs to
today (redshift 0)
Supercomputer
SuperMUC-NG (LRZ, Garching) for the hydro run; Cosma8 (DiRAC, Durham) for the large neutrino run
Compute
More than 120,000 cores on SuperMUC-NG for almost two months
Led by
Volker Springel, Rüdiger Pakmor, César Hernández-Aguayo, Lars Hernquist, Carlos Frenk, Simon White
Image: nIFTy cluster in OpenGadget3 (MFM and SPH): Groth et al. 2023, MNRAS 526, 616, arXiv:2301.03612, Fig. 17
Method
N-body, TreePM, SPH
A modern descendant of the GADGET family of programs, which compute how matter pulls together and how gas flows in a simulated universe. OpenGadget3 brings two ways of handling gas, runs parts of the work on graphics cards, and carries the recipes for galaxies, black holes and magnetic fields used in the Magneticum simulations.
GADGET derivative, a C++-compilable re-base of GADGET-2, with SPH and meshless finite mass hydrodynamics, GPU modules and the Magneticum galaxy-formation model.
Its meshless finite mass solver tracks decaying subsonic turbulence well down to Mach numbers near 0.01.
Simulates
dark matter, gas, stars, black holes, magnetic fields, cosmic rays, clusters
Method
N-body, TreePM, SPH, meshless
Led by
Frederick Groth, Ulrich P. Steinwandel, Milena Valentini, Klaus Dolag
Image: Nadler et al. 2022, arXiv:2209.02675, Fig. 2
Big galaxies and galaxy clusters are surrounded by swarms of smaller dark matter clumps, and Symphony asks whether those swarms look alike at every scale. It gathers 262 detailed dark-matter-only zooms, from hosts the size of the Large Magellanic Cloud up to clusters, all drawn at the same relative sharpness. Clusters turned out to carry about half again as many satellites.
262 dark-matter-only zooms from LMC-mass to cluster-mass hosts at matched relative resolution, compiled to compare substructure across four decades in mass.
At fixed sub-to-host mass ratio, clusters hold about 50 per cent more subhaloes than lower-mass hosts.
Simulates
dark matter, Milky Way analogues, clusters, dwarf galaxies
Method
N-body
Mass resolution
≈3×10⁻⁷ of the host virial mass
Runs to
today (redshift 0)
Led by
Ethan O. Nadler, Philip Mansfield, Yunchong Wang, Xiaolong Du, Susmita Adhikari, Risa H. Wechsler
352 zoom-in cluster regions drawn from a 1 Gpc parent box (data table lists N_DM 81923 equivalent)
Machine
HoreKa, Raven, Cobra
The biggest gatherings of galaxies are rare, so a typical simulated universe holds only a handful. TNG-Cluster picked 352 of the most massive clusters from a region about 3.3 billion light-years across and rebuilt each one in full detail, with the same IllustrisTNG physics as before. It includes every cluster above a million billion Suns in that volume.
Resimulates 352 massive galaxy clusters from a volume 36 times larger than TNG300, with the TNG model and resolution kept exactly as they were.
The sample includes every halo above 10^15 solar masses in its 1 Gpc parent volume.
Simulates
dark matter, gas, stars, black holes, magnetic fields, clusters, galaxies
Method
moving mesh, TreePM
Code
AREPO
Box
1,003.8 Mpc on a side
Particles
352 zoom-in cluster regions drawn from a 1 Gpc parent box (data table lists N_DM 81923 equivalent)
Mass resolution
DM 6.1×10⁷ M☉; gas 1.2×10⁷ M☉ (TNG300-1 resolution)
Image: Ramesh & Nelson 2023, arXiv:2307.11143, Fig. 1
Particles
Eight Milky Way-like galaxies from TNG50 re-simulated with super-Lagrangian CGM refinement
Around every big galaxy lies a vast, thin halo of gas, where fuel arrives and wind-blown gas returns. GIBLE takes eight Milky Way-like galaxies from the TNG50 simulation and redraws that halo in far finer detail than usual: about 250 light-years near the galaxy and about 2,300 light-years at its outer edge. The name stands for Gas Is Better resoLved around galaxiEs.
Gas Is Better resoLved around galaxiEs: TNG-model zoom-ins that refine the gas halo around Milky Way-like galaxies far beyond the galaxy itself.
Median gas resolution reaches about 75 parsecs near the galaxy and stays around 700 parsecs out at the virial radius.
Simulates
dark matter, gas, stars, black holes, magnetic fields, Milky Way analogues
Method
moving mesh
Code
AREPO
Particles
Eight Milky Way-like galaxies from TNG50 re-simulated with super-Lagrangian CGM refinement
Mass resolution
Galaxy at TNG50-2 level (gas ~8×10⁵ M☉); CGM gas down to ~103 M☉ (512 times better)
Image: Bayer, Zhong et al. 2024, arXiv:2407.17462, Fig. 2 (full-sky matter overdensity at z = 1 from one full-resolution run)
Box
3,750 Mpc/h
Particles
2.3 × 10¹¹
Machine
Stampede2
HalfDome is a set of twelve dark matter universes, each a cube about 18 billion light-years across, built so that one simulated sky can serve many different telescopes at once. Its full-sky maps, recorded as light would reach an observer, let teams combine galaxy surveys with maps of the oldest light in the Universe. Eleven runs share the standard cosmology; the twelfth adds a small twist to the Universe's starting ripples to test theories of its first instant.
Twelve 6144^3 FastPM runs in 3.75 Gpc/h boxes with full-sky lightcones, halo catalogues and mass and velocity sheets from z = 0 to 4, for joint analyses of Stage-IV galaxy and CMB surveys.
Its initial public release alone is 300 terabytes.
Simulates
dark matter, large-scale structure
Method
N-body, PM
Code
FastPM
Box
3,750 Mpc/h on a side
Particles
61443 (≈232 billion) per run; 11 fixed-cosmology runs plus one with primordial non-Gaussianity
Mass resolution
1.95×10¹⁰ M☉/h
Runs to
today (redshift 0)
Supercomputer
Stampede2, Texas Advanced Computing Center (2,048 KNL nodes per full-resolution run); a half-resolution test on Cori, NERSC
Compute
4.38 hours wall-clock per full-resolution run on 2,048 nodes
Led by
Adrian E. Bayer, Yici Zhong, Zack Li, Joseph DeRose, Yu Feng, Jia Liu
Institutions
Princeton University, Flatiron Institute, University of Tokyo (Kavli IPMU), Lawrence Berkeley National Laboratory, University of California, Berkeley, Canadian Institute for Theoretical Astrophysics
Image: Matthieu Schaller, Stuart McAlpine (PMillennium re-simulation)
Method
N-body, FMM, PM
An open-source program for simulating how matter and gas move under gravity, written to keep every processor of a modern supercomputer busy. Instead of dividing space evenly among processors, it splits the work into many small tasks and hands them out as they become ready. FLAMINGO and COLIBRE were both run with it.
Fully open-source (LGPL-3.0) gravity and SPH code built on task-based parallelism, balancing work rather than data across modern supercomputers.
FLAMINGO was run with SWIFT; the code paper demonstrated weak scaling on a hydrodynamical problem of about 300 billion particles.
Simulates
dark matter, gas, stars, black holes, neutrinos, galaxies
Method
N-body, FMM, PM, SPH
Led by
Matthieu Schaller, Josh Borrow, Peter W. Draper, Mladen Ivkovic, Stuart McAlpine
Image: Brauer et al. 2025, arXiv:2410.16366, Fig. 1: gas density, temperature, [Fe/H] and [N/O] of the fiducial Aeos simulation at z=14.5
Box
1 cMpc
Aeos rebuilds the first 300 million years of cosmic history one star at a time, in a small patch of space about three million light-years across. It follows each star and the chemical elements it makes when it dies, so that the oldest stars still seen in our galaxy today can be traced back to the first tiny galaxies where they formed.
Star-by-star cosmological simulations of the first 300 million years that track each star and its chemical yields to link ancient stars to early galaxies.
By redshift 14.5 the 1 Mpc volume held 91 star-forming haloes and about 250,000 star and stellar remnant particles.
Simulates
dark matter, gas, first stars, stars, radiation, galaxies
Method
AMR, radiative transfer
Code
Enzo (Enzo+Moray)
Box
1 cMpc on a side
Mass resolution
DM 1840 M☉; 1 pc physical
Runs to
redshift 14.5
Supercomputer
Texas Advanced Computing Center
Led by
Kaley Brauer, Andrew Emerick, Jennifer Mead, Alexander P. Ji, John H. Wise, Greg L. Bryan
Boxes of 51.7 and 110.7 Mpc (TNG50 and TNG100 initial conditions) in six dark matter models, two resolutions each
Machine
Leonardo, LUMI
Nobody knows what dark matter is made of, so AIDA-TNG tries six candidates side by side: cold, three kinds of warm, and two that can bump into each other. Each version reruns the same regions of space, up to about 360 million light-years across, with the same galaxy recipe. Even though that recipe was tuned for cold dark matter, all six produced realistic galaxies.
Reruns TNG50- and TNG100-sized boxes with cold, three warm and two self-interacting dark matter models, keeping the TNG galaxy formation model fixed.
Despite calibration on cold dark matter, the TNG model still yields realistic galaxy populations in all six dark matter scenarios.
Simulates
dark matter, gas, stars, black holes, magnetic fields, galaxies
Method
moving mesh, TreePM
Code
AREPO
Box
110.7 Mpc on a side
Particles
Boxes of 51.7 and 110.7 Mpc (TNG50 and TNG100 initial conditions) in six dark matter models, two resolutions each
Runs to
today (redshift 0)
Supercomputer
Leonardo (Italy) and LUMI (Finland), per Media INAF quoted on the project media page
Image: The COLIBRE Team (Schaye et al. 2026); 25 cMpc slice of gas density in L400m7
Box
400 cMpc
Particles
1.4 × 10¹¹
Machine
DiRAC
Earlier large simulations treated the cold gas inside galaxies as a smooth, propped-up blur. COLIBRE lets that gas cool to the cold clouds where stars really form, and tracks dust grains directly, across regions up to 1.3 billion light-years wide. Its dark matter is split into four times as many particles as gas, so the stars are not jostled by heavy dark-matter particles.
Galaxy-formation volumes that model a cold multiphase interstellar medium and dust grains directly, without the pressure floor used by earlier large simulations.
Dark matter is supersampled four to one, so dark-matter and gas particles have similar masses and stars are not spuriously heated.
Simulates
dark matter, gas, stars, black holes, dust, galaxies
Method
FMM, SPH
Code
SWIFT (SPHENIX SPH)
Box
400 cMpc on a side
Particles
Largest runs 136 billion (5×30083)
Mass resolution
about 105 (m5), 106 (m6), 107 (m7) M☉ for both baryons and dark matter
Runs to
today (redshift 0)
Supercomputer
DiRAC@Durham
Led by
Joop Schaye, Evgenii Chaikin, Matthieu Schaller, Sylvia Ploeckinger, Filip Huško
Image: Beltz-Mohrmann et al. 2025, arXiv:2503.05947, Fig. 2 (the same region at z = 0 in ΛCDM, blue, and w0waCDM, yellow, and overlaid)
Box
1,500 Mpc
Particles
3.0 × 10¹¹
Machine
Aurora
Two copies of the same universe, started from identical seeds, that differ only in dark energy: one keeps it constant, the other lets it change over time as early results from the DESI survey hinted. Each holds about 300 billion particles of dark matter in a cube nearly five billion light-years across. Laid side by side, they show where a changing dark energy would leave its mark on the growth of structure.
A matched pair of 6720^3 HACC runs in 1.5 Gpc boxes, one ΛCDM and one w0waCDM with DESI Y1 BAO + CMB parameters, run on Aurora to isolate the effect of evolving dark energy.
Each run took about two days on a tenth of Aurora, fast enough to test new cosmological results almost as they are announced.
Simulates
dark matter, dark energy, large-scale structure
Method
N-body
Code
HACC
Box
1,500 Mpc on a side
Particles
67203 (≈303 billion) in each of two runs, ΛCDM and w0waCDM
Mass resolution
~4×10⁸ M☉
Runs to
today (redshift 0)
Supercomputer
Aurora, Argonne Leadership Computing Facility (960 nodes, 5,760 GPUs, about 10% of the machine)
Compute
About two days per run, including in-situ analysis and I/O
Led by
Gillian D. Beltz-Mohrmann, Adrian Pope, Katrin Heitmann, Nicholas Frontiere, Andrew P. Hearin
Institutions
Argonne National Laboratory, Institute of Space Sciences (ICE-CSIC), Donostia International Physics Center
A mock universe made to prepare for Euclid, the European space telescope mapping billions of galaxies. Four trillion particles of dark matter fill a cube about 17 billion light-years across, and 3.4 billion artificial galaxies were placed in them to imitate what Euclid should see. More than 80 per cent of the Piz Daint supercomputer was given over to the job in 2019.
A four-trillion-particle run with an on-the-fly lightcone, populated with 3.4 billion mock galaxies to prepare analysis of Euclid data.
More than 80 per cent of Piz Daint, then the world's third most powerful supercomputer, was given to the run.
Simulates
dark matter, large-scale structure, galaxies
Method
N-body, FMM
Code
PKDGRAV3
Box
3,600 Mpc/h on a side
Particles
160003 (≈4.1 trillion)
Mass resolution
109 M☉/h
Runs to
today (redshift 0)
Supercomputer
Piz Daint, Swiss National Supercomputing Centre (CSCS), run in 2019
Led by
Francisco J. Castander, Pablo Fosalba, Joachim Stadel, Douglas Potter
Institutions
University of Zurich, Swiss National Supercomputing Centre (CSCS), Port d'Informació Científica (PIC), Euclid Consortium
Image: Frontiere et al. 2025, arXiv:2510.03557, Fig. 3 (total matter density at z = 0)
Box
4,700 Mpc
Particles
4.0 × 10¹²
Machine
Frontier
The largest simulated universe yet to include ordinary gas, stars and black holes alongside dark matter: four trillion particles, half gas and half dark matter, in a cube about 15 billion light-years across. It ran on 9,000 nodes of Oak Ridge's Frontier supercomputer for just over a week. Adding the gas made it about 16 times more expensive than the same run with gravity alone.
A four-trillion-particle CRK-HACC run in a 4.7 Gpc box with cooling, star formation, supernova and black-hole feedback, the first trillion-particle cosmological hydrodynamics simulation.
It wrote more than 100 petabytes of data while spending less than 3 per cent of its runtime doing so.
Simulates
dark matter, gas, stars, black holes, galaxies, large-scale structure
Method
N-body, SPH
Code
CRK-HACC
Box
4,700 Mpc on a side
Particles
2 × 126003 (≈4 trillion, half gas, half dark matter)
Runs to
today (redshift 0)
Supercomputer
Frontier, Oak Ridge Leadership Computing Facility (9,000 nodes); subgrid models calibrated on Perlmutter, NERSC
Compute
196 hours wall-clock, just over 1.7 million node-hours on Frontier
Led by
Nicholas Frontiere, J. D. Emberson, Michael Buehlmann, Esteban M. Rangel, Salman Habib, Katrin Heitmann
Institutions
Argonne National Laboratory, Oak Ridge National Laboratory, Northwestern University
Image: Wang et al. 2025, arXiv:2510.27291, Fig. 1 (dark matter density at z = 0, full 2.5 Gpc/h box and zooms)
Box
2,500 Mpc/h
Particles
4.2 × 10¹²
Machine
ORISE
HyperMillennium follows 4.2 trillion particles of dark matter in a cube about 12 billion light-years on a side, built by a Chinese-led international team. Its first test was one extreme object: the team searched the simulation for twins of Abell 2744, a giant galaxy cluster mapped in detail by the James Webb Space Telescope, and found close matches. Galaxies are added afterwards with a separate model, so mock surveys can be drawn from the whole volume.
A 16128^3 dark-matter run in a 2.5 Gpc/h box with 100 snapshots and semi-analytic galaxies, built for surveys such as CSST and Euclid; its first paper reproduces Abell 2744 in detail.
Among 851 simulated haloes above 10^15 Msun/h near redshift 0.3, it found Abell 2744 analogues whose galaxy and mass maps match the real cluster down to about 50 kpc.
Simulates
dark matter, large-scale structure, clusters, galaxies
Method
N-body, PM, FMM, semi-analytic
Code
PhotoNs-3.7 (+ L-Galaxies semi-analytic model)
Box
2,500 Mpc/h on a side
Particles
161283 (≈4.2 trillion)
Mass resolution
3.2×10⁸ M☉/h
Runs to
today (redshift 0)
Supercomputer
ORISE supercomputer, China (GPGPU architecture)
Compute
More than 100 million CPU core-hours and 10 million accelerator-card hours, on over 10,000 accelerator cards (Xinhua via CAS)
Led by
Qiao Wang, Ming Li, Liang Gao, Qi Guo, Raul E. Angulo, Carlos S. Frenk, Simon D. M. White
Institutions
National Astronomical Observatories, Chinese Academy of Sciences (NAOC), Beijing Normal University, Shanghai Astronomical Observatory, Donostia International Physics Center, Institute for Computational Cosmology, Durham University, Max Planck Institute for Astrophysics, Yonsei University
Countries
China, Spain, United Kingdom, Germany, South Korea, United States
Jiutian is the set of computer universes built for CSST, China's planned survey telescope. Three large dark-matter runs, in cubes from about 1.4 to 9.3 billion light-years on a side, sit alongside 129 smaller runs that teach a fast predictor to within one per cent, plus copies of our real neighbourhood and alternative cosmologies. Together they are the toolkit for reading the survey's maps.
A hybrid suite for China's CSST survey telescope: three 6144^3 primary runs, 129 emulator runs, constrained reconstructions and alternative-cosmology extensions.
Its 129 emulator runs train a matter power spectrum emulator accurate to one per cent for k up to 10 h/Mpc.
Simulates
dark matter, large-scale structure, galaxies, neutrinos
Image: Visualisation GLOBAÏA from Manticore-Local (McAlpine et al. 2025)
Box
1,000 Mpc
Particles
1.1 × 10⁹
Machine
DiRAC, Joliot-Curie
Manticore-Local is a copy of our real cosmic neighbourhood, rebuilt from a map of nearby galaxies so that the simulation's clusters, filaments and voids sit where the real ones are. Because that map cannot pin everything down, the reconstruction was run 80 times from slightly different starting conditions, and the structures that appear in most runs are the ones to trust. Each run is a cube about 3.3 billion light-years across with the Milky Way at its centre.
A suite of 80 Bayesian constrained realisations of the local Universe, inferred from 2M++ galaxies with BORG and resimulated at 1024^3 with SWIFT, giving posterior maps of local structure, clusters and flows.
Fourteen prominent nearby galaxy clusters each have a counterpart in the simulation within one degree of their observed position on the sky.
Simulates
dark matter, large-scale structure, clusters
Method
N-body
Code
SWIFT (N-body resimulations) of BORG field-level inference
Box
1,000 Mpc on a side
Particles
10243 (≈1.07 billion) per realisation, 80 posterior realisations
Mass resolution
3.7×10¹⁰ M☉
Runs to
today (redshift 0)
Supercomputer
PDC (KTH Royal Institute of Technology), DiRAC@Durham, Infinity (IAP Paris) and TGCC Irène-Joliot-Curie, as acknowledged; the split between inference and resimulation is not stated
Compute
About 750,000 CPU hours per BORG inference chain (512 cores each)
Led by
Stuart McAlpine, Jens Jasche, Metin Ata, Guilhem Lavaux, Richard Stiskalek, Carlos S. Frenk, Adrian Jenkins
Institutions
Oskar Klein Centre, Stockholm University, Institut d'Astrophysique de Paris, Institute for Computational Cosmology, Durham University, University of Oxford, Yukawa Institute for Theoretical Physics, Kyoto University, Flatiron Institute
Countries
Sweden, France, United Kingdom, Japan, United States
60 zoom-in simulations of 14 target galaxies (fiducial runs plus variations)
Machine
SuperMUC-NG
Fourteen young galaxies from the THESAN simulation, picked out and regrown in close-up during the Universe's first two billion years. Each is fed the uneven early light of its original surroundings, while inside it the gas is drawn finely enough to show cold clouds and hot bubbles, with single gas elements of about 142 Suns. The question is how such early galaxies grew and shone.
Zoom-in radiation-hydrodynamic resimulations of 14 high-redshift galaxies from THESAN, with a multi-phase interstellar medium and the parent box's patchy reionization field fed in from outside.
At its finest, a single gas element weighs about 142 solar masses, inside galaxies seen during the first two billion years.
Simulates
dark matter, gas, stars, radiation, dust, reionization, galaxies, dwarf galaxies
Method
moving mesh, radiative transfer
Code
AREPO
Particles
60 zoom-in simulations of 14 target galaxies (fiducial runs plus variations)
Mass resolution
Highest resolution: baryonic mass 142 M☉, softening 17 cpc
A region of space about 1.6 billion light-years across, followed until the Universe was about two billion years old with its light computed alongside its gas. Lumina tracks how the first galaxies and black holes stripped electrons first from hydrogen and then from helium. It ran on about a fifth of Frontier, at peak using some 600 terabytes of memory.
A 500 cMpc radiation-hydrodynamic run that adds on-the-fly radiative transfer to the TNG model to follow both hydrogen and helium reionization down to redshift 3.
Peak memory reached about 600 terabytes, and single checkpoints were around 250 terabytes.
Simulates
dark matter, gas, stars, black holes, radiation, reionization, galaxies, large-scale structure
Method
moving mesh, radiative transfer
Code
AREPO (GPU-accelerated AREPO-RT)
Box
500 Mpc on a side
Particles
2 × 60003 (~432 billion)
Mass resolution
DM 1.9×10⁷ M☉; baryonic 3.6×10⁶ M☉
Runs to
redshift 3
Supercomputer
Frontier, Oak Ridge National Laboratory (INCITE award)
Compute
1,884 nodes: 105,504 CPU cores and 7,536 AMD GPUs (about 20% of Frontier)
Led by
Oliver Zier, Aaron Smith, Xuejian Shen, Rongrong Liu, Rahul Kannan
Institutions
Harvard-Smithsonian CfA, MIT, MPA Garching, University of Texas at Dallas, York University
Each dot is a survey, placed by the year it began and by how many objects it catalogued, on a logarithmic scale. Drag across the chart to keep only those years.
Years before 1975 are compressed into the first 30% of the axis.
Catalogues & plates
Redshift surveys
Imaging surveys
Weak lensing
Velocities & distances
Deep fields
Cosmic microwave background
X-ray
Radio
Space missions
Catalogues & plates·1774–1781Milestone
Image: Michael A. Phillips
Objects
110
Charles Messier spent his nights in 18th-century Paris hunting comets, and kept tripping over faint smudges that never moved. So he wrote them down, a list of things not to mistake for a comet. Those fuzzy patches turned out to be star clusters, glowing gas clouds and whole galaxies such as Andromeda (M31), and their names, M1 to M110, are still used by stargazers everywhere.
A list of fuzzy objects that could be confused with comets, which became the first widely used catalogue of nebulae, clusters and galaxies.
Messier was hunting comets; the catalogue was a list of things to ignore. Later astronomers added M104 to M110 from his notes.
Measures
galaxy positions
Telescope
Small refracting telescopes
Site
Paris, France
Light
optical
Objects
45 objects (1774 list); 103 in the final 1781 list; 110 today
Led by
Charles Messier
Countries
France
Data
Public
Messier 1781, Connaissance des Temps pour 1784
Catalogues & plates·1888
Image: GLOBAÏA all-sky plot of the 7,840 NGC objects, positions from NGC 2000.0 (Sinnott 1988, VizieR VII/118); galaxies blue, star clusters amber, nebulae pink
Objects
7,840
John Dreyer, a Danish-born astronomer working in Ireland, gathered the nebulae and star clusters known in his day into one numbered list of 7,840 entries. Many of those faint patches were later revealed to be entire galaxies far beyond our own. When you read that a galaxy is called NGC 1300 or NGC 4565, the number comes straight from Dreyer's 1888 catalogue.
Dreyer's compilation of nebulae and star clusters, built on the Herschels' catalogues, still the source of most galaxy names in use today.
The NGC and its two Index Catalogue supplements together list 13,226 objects.
Measures
galaxy positions
Light
optical
Objects
7,840 objects; Index Catalogues add 5,386 (1895, 1908)
Led by
John Louis Emil Dreyer
Data
Public
Dreyer 1888, Memoirs of the Royal Astronomical Society 49
Catalogues & plates·1932Milestone
Image: Shapley & Ames 1932, Annals of Harvard College Observatory 88, 41, Figure 3 (sky distribution of the 1,249 catalogued galaxies, Aitoff projection); scan: Harvard-Smithsonian CfA Wolbach Library / NASA ADS (tones inverted)
Objects
1,249
A head count of the brightest galaxies across the whole sky, made at Harvard by Harlow Shapley and Adelaide Ames from photographic plates. Their 1,249 galaxies were not sprinkled evenly. They crowded together, most strikingly towards the constellation Virgo, where a great cluster lies, an early hint that the universe is lumpy on very large scales.
A magnitude-limited census of the brightest galaxies over the whole sky, which showed their uneven distribution and the rich concentration in Virgo.
Revised in 1981 by Sandage and Tammann as the Revised Shapley-Ames Catalog; three original entries were dropped as not galaxies.
Measures
galaxy positions
Telescope
Harvard College Observatory photographic plates
Light
optical
Objects
1,249 galaxies brighter than magnitude 13.2
Led by
Harlow Shapley, Adelaide Ames
Institutions
Harvard College Observatory
Countries
United States
Data
Public
Shapley & Ames 1932, Annals of Harvard College Observatory 88
Is the universe the same everywhere, if you look far enough? Edwin Hubble tried to find out by counting galaxies, about 44,000 of them, on 1,283 photographic plates taken at Mount Wilson. Away from the Milky Way the counts came out roughly even, but a band along our galaxy's plane was almost empty: its dust was hiding everything behind it.
Hubble counted galaxies on deep plates across the sky north of declination -30 degrees to test whether the universe is uniform on large scales.
The counts revealed the zone of avoidance, where dust in the Milky Way hides galaxies along the galactic plane.
Image: Map of the Shane–Wirtanen Lick galaxy counts (Seldner, Siebers, Groth & Peebles 1977), as reproduced by Peter Coles, In the Dark blog
Objects
1.0 × 10⁶
Reach
limiting magnitude B ≈ 18.9
Two astronomers at Lick Observatory, Donald Shane and Carl Wirtanen, spent more than ten years counting galaxies by eye on photographic plates, one small square at a time. Their tally came to nearly a million. Turned into a map, the counts showed a lacy pattern of clusters and strands, an early glimpse of what astronomers now call the cosmic web.
A decade of counting galaxies by eye on astrograph plates produced the first map of about a million galaxies, revealing a network of clusters and filaments.
Counting ran 1948 to 1959; the maps and analysis were published in 1967. Plates covered 1,390 fields north of declination -33 degrees.
Measures
galaxy positions, large-scale structure
Telescope
20-inch Astrograph
Site
Lick Observatory, California
Light
optical
Objects
nearly one million galaxies counted by eye
Reach
limiting magnitude B ≈ 18.9
Led by
C. Donald Shane, Carl A. Wirtanen
Institutions
Lick Observatory
Countries
United States
Data
Public
Catalogues & plates·1949–1958Milestone
Palomar Sky Survey
Image: NASA/ESA, the DSS-II and GSC-II Consortia (Digitized Sky Survey I view of the Rosette Nebula)
Objects
936 red/blue plate pairs (almost 2,000 plates)
Reach
≈ magnitude 22 (commonly quoted average)
A giant photographic atlas of the northern sky, taken in the 1950s with a wide-field telescope on Palomar Mountain. Every patch was photographed twice, once in red light and once in blue, on almost 2,000 glass plates. For decades astronomers searched copies of these plates by eye, and the first big catalogues of galaxies and clusters, Abell's and Zwicky's, were drawn from them.
The first deep photographic atlas of the whole northern sky in two colours, the reference map from which Abell and Zwicky drew their galaxy and cluster catalogues.
Each 14-inch square plate covered about 6 by 6 degrees; the survey reached plate centres down to declination -30 degrees.
Measures
galaxy positions
Telescope
48-inch (1.2 m) Palomar Schmidt telescope (now Samuel Oschin Telescope)
Site
Palomar Observatory, California
Light
optical
Objects
936 red/blue plate pairs (almost 2,000 plates)
Reach
≈ magnitude 22 (commonly quoted average)
Led by
Edwin Hubble, Milton L. Humason, Walter Baade, Ira Sprague Bowen, Rudolph Minkowski
Institutions
California Institute of Technology, National Geographic Society
Countries
United States
Data
Public
Catalogues & plates·1958–1989Milestone
Image: NASA Hubble
Objects
4,073
Reach
nominal z ≈ 0.02 to 0.2
George Abell went through the Palomar sky photographs himself, plate by plate, looking for places where galaxies were packed into great swarms. Each swarm, a galaxy cluster, can hold hundreds or even thousands of galaxies held together by gravity. His 1958 list, later extended to the southern sky, was the standard catalogue of clusters for decades, and names like Abell 1689 still come from it.
Abell searched the Palomar plates by eye for rich concentrations of galaxies, producing the standard all-sky list of galaxy clusters for decades.
Abell inspected the POSS red plates himself; the 1989 ACO supplement added 1,361 southern clusters.
Measures
galaxy clusters
Telescope
POSS-I red plates (north); UK Schmidt IIIa-J plates (south)
Light
optical
Objects
2,712 clusters (1958); 4,073 with the 1989 southern supplement
Reach
nominal z ≈ 0.02 to 0.2
Led by
George O. Abell, Harold G. Corwin Jr., Ronald P. Olowin
Image: Falco et al. 1999, PASP 111, 438 (The Updated Zwicky Catalog), Fig. 4: distribution on the sky of the UZC galaxies (tones inverted)
Objects
29,418
Fritz Zwicky and his colleagues at Caltech catalogued nearly 30,000 northern galaxies and more than 9,000 clusters, noting how bright each galaxy looked. The work filled six volumes and took eight years. Those brightness measurements later told the first big 3D mapping project, the CfA redshift survey, which galaxies to point its telescope at.
Zwicky's six-volume catalogue of northern galaxies and clusters, whose galaxy magnitudes supplied the target list for the first CfA redshift survey.
Published in six volumes over eight years; CfA1 drew its galaxies brighter than 14.5 from the Zwicky and Nilson catalogues.
Measures
galaxy positions, galaxy clusters
Light
optical
Objects
29,418 galaxies and 9,134 clusters
Led by
Fritz Zwicky
Institutions
California Institute of Technology
Countries
United States
Data
Public
Zwicky et al. 1961–1968, CGCG (6 volumes)
Cosmic microwave background·1964–1965Milestone
Image: NASA
Reach
z ≈ 1100 (last scattering)
Two radio astronomers at Bell Labs, Arno Penzias and Robert Wilson, could not get rid of a faint hiss in their big horn-shaped antenna. It came from every direction and never changed with the seasons. It was the leftover heat of the Big Bang, light released when the young universe first became transparent and now cooled to a few degrees above absolute zero, and it earned them the Nobel Prize.
An unexplained 3.5 K of excess noise in a Bell Labs horn antenna turned out to be the afterglow of the Big Bang.
The excess was the same in every direction and showed no seasonal change from July 1964 to April 1965. Nobel Prize in Physics, 1978.
606 fields on IIIa-J plates south of declination -17°
The southern sky's answer to the Palomar atlas, photographed from Siding Spring in Australia with the UK Schmidt telescope. It covered the southern sky in 606 fields on fine-grained glass plates sensitive to blue light. Years later, machines in Britain scanned those plates automatically, turning the photographs into galaxy catalogues far bigger than anyone could have counted by hand.
The southern counterpart to the Palomar survey, whose fine-grained blue plates were later machine-scanned to build the APM and Edinburgh/Durham galaxy catalogues.
The UK Schmidt began work at Siding Spring in 1973 with the photographic survey of the whole southern sky as its first task.
Measures
galaxy positions
Telescope
1.2 m UK Schmidt Telescope
Site
Siding Spring Observatory, New South Wales, Australia
Light
optical
Objects
606 fields on IIIa-J plates south of declination -17°
Institutions
Science and Engineering Research Council, European Southern Observatory
galaxies brighter than mB 14.5 at high galactic latitude
A photograph of the sky is flat: it shows where galaxies are, but not how far away. From 1977 a team at the Harvard-Smithsonian Center for Astrophysics measured the redshift of one bright galaxy after another, the stretching of its light that grows with distance. That gave the third dimension, and the first large 3D map of our cosmic neighbourhood.
The first large systematic redshift survey, turning sky positions into a three-dimensional map of the nearby universe.
The data paper (Huchra et al. 1983, ApJS 52, 89) listed the redshifts drawn from the merged Zwicky and Nilson catalogues.
Measures
redshifts, large-scale structure
Telescope
1.5 m Tillinghast telescope
Site
Fred Lawrence Whipple Observatory, Arizona
Light
optical
Objects
galaxies brighter than mB 14.5 at high galactic latitude
A satellite telescope chilled by liquid helium that, over ten months in 1983, scanned almost the whole sky in far-infrared light, the heat glow our eyes cannot see. Infrared passes through the dust that blocks ordinary light, so IRAS found galaxies other surveys missed. Its list of about a quarter of a million sources later guided several 3D maps of the nearby universe.
The first all-sky survey at far-infrared wavelengths, whose galaxy catalogue, unhindered by dust, seeded the QDOT, 1.2 Jy and PSCz redshift surveys.
Launched 25 January 1983, it mapped 96% of the sky four times in ten months before its liquid helium ran out.
A small Soviet radio receiver riding on the Prognoz 9 satellite, launched in 1983 to map the Big Bang's afterglow from space for the first time. Over six months it scanned the whole sky, taking some 15 million measurements. It caught the warmer and cooler halves of the sky caused by our own motion through space, and a 1992 reanalysis claimed a hint of fainter ripples, months before COBE's announcement.
The first space experiment to map the microwave background, measuring the dipole and, in a 1992 reanalysis, a hint of the quadrupole.
Launched 1 July 1983, it scanned the whole sky in six months; its quadrupole claim was announced in January 1992, months before COBE's.
Image: First CfA2 strip, the 'stickman' slice (de Lapparent, Geller & Huchra 1986). Copyright SAO 1998, from John Huchra's CfA Redshift Survey pages (tones inverted)
Objects
18,000
Reach
mB ≤ 15.5
The Harvard team went back for more, measuring redshifts, and so distances, for about 18,000 bright northern galaxies. In 1986 the first thin slice through space came out looking like a cut through soap suds: galaxies sit on the skins of vast bubbles that are nearly empty inside. Three years later the fuller map revealed the Great Wall, a sheet of galaxies hundreds of millions of light-years long.
Its first thin slice showed galaxies lying on the walls of huge empty bubbles, and the full survey revealed the Great Wall.
The 1986 'slice of the universe' held about 1,100 galaxies; the Great Wall followed in Geller and Huchra's 1989 Science paper.
Part of National Geographic Society – Palomar Observatory Sky Survey (POSS-I)
Image: NASA/ESA, the DSS-II and GSC-II Consortia (with images from the Palomar Observatory-STScI Digital Sky Survey of the northern sky, based on scans of the Second Palomar Sky Survey, copyright 1993-1999 by the California Institute of Technology)
Objects
897 northern fields in three bands (IIIa-J, IIIa-F, IV-N)
Reach
about 1 to 1.5 magnitudes deeper than POSS-I
A second, deeper photographic tour of the northern sky from the same Palomar telescope, this time in three colours, taken between the mid-1980s and 2000. Its plates were later scanned into the Digitized Sky Survey, the images astronomers still pull up to see what lies at a given spot on the sky before they observe it.
A deeper three-colour photographic resurvey of the northern sky whose digitised plates feed the Digitized Sky Survey still used for finding charts.
Year span 1985 to 2000 is from the VizieR plate catalogue; Reid placed the start of plate-taking in 1987.
Measures
galaxy positions
Telescope
48-inch Oschin Schmidt telescope
Site
Palomar Observatory, California
Light
optical
Objects
897 northern fields in three bands (IIIa-J, IIIa-F, IV-N)
NASA's COBE satellite took the temperature of the Big Bang's afterglow and found 2.725 degrees above absolute zero, almost exactly the glow a perfect hot body should give off. It also found tiny hot and cold spots, differences of one part in 100,000. Those faint ripples were the seeds from which every galaxy and cluster later grew, and the work won the 2006 Nobel Prize in Physics.
COBE showed the microwave background is a near-perfect blackbody at 2.725 K and found the faint ripples, one part in 100,000, that seeded all structure.
The DMR ripples were announced on 23 April 1992; Mather and Smoot shared the 2006 Nobel Prize in Physics.
Image: Two million galaxies: APM Galaxy Survey map. Credit & Copyright: S. Maddox (Nottingham U.) et al.
Objects
180 UKST fields; bright catalogue of 14,681 galaxies to bJ 16.44
Sky area
4,180 deg²
In Cambridge, a machine called the Automated Plate Measuring facility scanned the Australian sky photographs and picked out galaxies far faster than any person could. The result was a map of some two million galaxies covering about a tenth of the sky. It showed galaxies clumped together on larger scales than the favoured theory of the day allowed, pushing cosmologists to rethink what the universe is made of.
Machine-scanned southern Schmidt plates gave an angular galaxy map whose large-scale clustering ruled against the standard cold dark matter model with Omega=1.
Its angular correlation function showed more clustering on large scales than the then-standard Omega=1 cold dark matter model predicted.
Measures
galaxy positions, large-scale structure
Telescope
UK Schmidt IIIa-J plates scanned by the Automated Plate Measuring facility, Cambridge
Light
optical
Sky area
4,180 deg²
Objects
180 UKST fields; bright catalogue of 14,681 galaxies to bJ 16.44
Led by
Steve Maddox, George Efstathiou, Will Sutherland, Jon Loveday
Institutions
Institute of Astronomy, Cambridge, Royal Greenwich Observatory, University of Oxford
ROSAT, a German-led X-ray satellite, spent six months in 1990 and 1991 sweeping its telescope across the entire sky, the first time the whole sky had been imaged in X-rays. X-rays reveal the hottest things in the universe, such as gas at tens of millions of degrees trapped inside galaxy clusters. The scan found more than 150,000 sources and supplied astronomers' cluster lists for the next twenty years.
The first imaging X-ray survey of the whole sky, the source of nearly every X-ray-selected galaxy cluster sample for two decades.
The all-sky scan took six months in 1990 and 1991; ROSAT was switched off in 1999 and fell back to Earth in 2011.
Measures
galaxy clusters, quasars
Telescope
84 cm Wolter I X-ray telescope on ROSAT
Site
Space (low Earth orbit)
Light
X-ray
Sky area
41,253 deg²
Objects
>150,000 sources; 18,811 in the Bright Source Catalogue
Led by
Wolfgang Voges
Institutions
Max Planck Institute for Extraterrestrial Physics, DLR, NASA
Image: Dr. Wendy L. Freedman, Observatories of the Carnegie Institution of Washington, and NASA
Objects
31
Reach
Nearby galaxies; secondary methods (SN Ia, Tully-Fisher, SBF, SN II, fundamental plane) reach farther
For decades astronomers argued over how fast the universe is expanding, with answers differing by about a factor of two. Wendy Freedman's team turned the Hubble Space Telescope on Cepheids, pulsing stars whose rhythm gives away their true brightness, in 18 nearby galaxies and used them as yardsticks. Their answer, 72 kilometres per second for every 3.26 million light-years, settled the quarrel to within 10 per cent.
Used Hubble to find Cepheid variable stars in nearby spirals and calibrate five secondary distance methods, settling the long dispute over the Hubble constant at the 10 percent level.
Its final combined value was H0 = 72 ± 8 km/s/Mpc; the work received the 2009 Gruber Cosmology Prize.
Measures
Cepheid distances, Hubble constant, supernovae
Telescope
Hubble Space Telescope (2.4 m), WFPC2
Site
Space (low Earth orbit)
Light
optical
Objects
Cepheid distances to 18 spiral galaxies, plus 13 more from published data (31 total)
Reach
Nearby galaxies; secondary methods (SN Ia, Tully-Fisher, SBF, SN II, fundamental plane) reach farther
Led by
Wendy L. Freedman, Robert C. Kennicutt, Jeremy R. Mould
Image: Böhringer et al. 2004, A&A 425, 367, Fig. 1: sky distribution of REFLEX clusters
Objects
447
Sky area
13,924 deg²
Reach
flux limit 3 × 10⁻¹² erg s⁻¹ cm⁻² (0.1–2.4 keV)
Take the X-ray sources ROSAT found in the southern sky, check which ones are really galaxy clusters, then measure how far away each lies with telescopes in Chile. That was REFLEX: 447 clusters over about a third of the sky. Counting how many big clusters exist, and how they bunch together, tests how much matter the universe holds and how its structure grew.
A complete, flux-limited sample of southern X-ray clusters from ROSAT with ESO redshifts, used to measure the clustering and abundance of clusters.
It covers 4.24 steradians of the southern sky, about 13,900 square degrees.
Image: NVSS source counts per HEALPix cell (Nside 32), from Wagenveld, Klöckner & Schwarz 2023, A&A 675, A72 (arXiv:2305.15335)
Objects
1.8 × 10⁶
Sky area
33,827 deg²
Reach
99% complete at ≈3.5 mJy
The Very Large Array in New Mexico, 27 radio dishes working as one, spent about three years photographing the sky in radio waves. It covered roughly four-fifths of the sky and catalogued some 1.8 million sources, most of them distant galaxies and quasars powered by giant black holes. Because radio galaxies shine across huge distances, the catalogue traces how matter is spread on the very largest scales.
A 1.4 GHz continuum survey of 82% of the sky that catalogued radio galaxies and quasars out to high redshift.
It covers everything north of declination -40 degrees at 45 arcsecond resolution.
Measures
galaxy positions, quasars, large-scale structure
Telescope
Very Large Array (D and DnC configurations), 1.4 GHz
Image: Riess et al. 1998, AJ 116, 1009, Fig. 4 (MLCS Hubble diagram and residuals), arXiv preprint p. 41
Objects
50
Reach
0.16 < z < 0.62
Brian Schmidt and Nicholas Suntzeff gathered an international team in 1994 to chase Type Ia supernovae, exploding stars that all blaze with nearly the same brightness and so act as lamps of known power. They hoped to measure how much the universe's expansion was slowing. In 1998 they found the opposite: distant supernovae looked too faint, too far away, because the expansion is speeding up.
An international team whose 1998 paper found distant supernovae 10 to 15 per cent farther than expected, the first published evidence of cosmic acceleration.
Formed in August 1994 by Brian Schmidt and Nicholas Suntzeff; shared the 2011 Nobel Prize in Physics.
Image: Robert Williams and the Hubble Deep Field Team (STScI), NASA
Objects
3,000
Sky area
0.002 deg²
In December 1995 the Hubble Space Telescope was pointed at a patch of sky in Ursa Major that looked empty, about a twelfth the width of the full Moon, and left to stare for ten days. The picture came back filled with about 3,000 galaxies, many seen as they were billions of years ago. Even the darkest corner of the sky, it turned out, is crowded.
Hubble stared for ten days at an apparently empty patch of Ursa Major, about 2.6 arcminutes across, and found it crowded with distant galaxies.
Taken 18 to 28 December 1995 from 342 exposures over about 150 orbits, using the STScI director's discretionary time.
Image: Shectman et al. 1996, ApJ 470, 172, Fig. 8g: LCRS galaxies in the three northern slices
Objects
26,418
Sky area
700 deg²
Reach
median cz ≈ 30,000 km/s
Rather than map a wide area shallowly, the Las Campanas team in Chile cut six long, thin strips through the sky and measured redshifts for more than 26,000 galaxies along them, reaching deeper than earlier maps. The bubbles and walls they found did not keep getting bigger with depth, a first hint that the universe evens out when viewed on large enough scales.
Six long thin strips reaching deeper than CfA2, the first survey large enough to suggest the cosmic web stops growing in scale.
Six strips of 1.5 by 80 degrees, three in each galactic cap; 80% of spectra came from a 112-fibre system. Year is publication.
Measures
redshifts, large-scale structure
Telescope
2.5 m du Pont telescope (spectra); 1 m Swope (photometry)
Site
Las Campanas Observatory, Chile
Light
optical
Sky area
700 deg²
Objects
26,418 redshifts
Reach
median cz ≈ 30,000 km/s
Led by
Stephen Shectman, Stephen Landy, Augustus Oemler, Douglas Tucker, Huan Lin, Robert Kirshner, Paul Schechter
Using a spectrograph that could take the light of 400 galaxies at once, astronomers at the Anglo-Australian Telescope measured redshifts for about 221,000 galaxies in five years. Laid out by distance, the two long strips of sky they covered became a 3D map reaching well over a billion light-years, showing the filaments and empty voids of the cosmic web in detail beyond our own neighbourhood for the first time.
Measured redshifts for about 221,000 galaxies in two long strips of sky, giving the first detailed 3D map of the cosmic web beyond our local neighbourhood.
Its 2dF spectrograph could observe 400 galaxies at once across a 2-degree field; observing ended in April 2002 after five years.
Quasars are the blazing centres of distant galaxies, lit by gas falling into giant black holes, and they can be seen across most of the universe. Running alongside the 2dF galaxy survey on the same Australian telescope, the 2QZ team measured redshifts for more than 23,000 faint quasars, reaching back to when the universe was only about two billion years old. The catalogue shows how quasars cluster and how their numbers changed over time.
Ran alongside 2dFGRS on the same telescope to collect redshifts for more than 23,000 faint quasars, mapping how quasars cluster and evolve across cosmic time.
By more than a factor of 50, it became the largest homogeneous quasar catalogue ever built at its faint limit.
Measures
quasars, redshifts, large-scale structure
Telescope
3.9 m Anglo-Australian Telescope, 2dF spectrograph
Site
Siding Spring Observatory, Australia
Light
optical
Sky area
721.6 deg²
Objects
23,338 quasars among 44,576 spectroscopically observed objects
Image: Sky distribution of HIPASS (HICAT) galaxies, colour-coded by velocity, from Meyer et al. 2004, MNRAS 350, 1195 (arXiv:astro-ph/0406384)
Objects
4,315
Reach
cz −1,280 to 12,700 km/s
Most surveys find galaxies by their starlight. HIPASS listened instead for the faint radio signal of hydrogen gas, using the 64-metre Parkes dish in Australia to sweep the whole southern sky. That way it caught gas-rich galaxies whatever the brightness of their stars, including dim ones that optical surveys had overlooked, and logged 4,315 of them along with their distances.
The first blind survey of neutral hydrogen over the whole southern sky, finding gas-rich galaxies regardless of how bright their stars are.
Survey observations comprised 23,020 eight-degree scans of nine minutes each.
Image: 2MASS/J. Carpenter/T. H. Jarrett/R. Hurt/FLWO/CTIO
Objects
4.7 × 10⁸
Sky area
41,253 deg²
Two matching telescopes, one in Arizona and one in Chile, photographed the entire sky in near-infrared light, just beyond the red our eyes can see. That light slips through much of the Milky Way's dust, so 2MASS could spot galaxies hidden behind our own galaxy's crowded disc. It catalogued over 470 million stars and other point-like sources and more than 1.6 million extended objects, mostly galaxies, and its data are free for anyone.
A whole-sky near-infrared survey in J, H and K that sees through Milky Way dust, giving the most uniform all-sky galaxy catalogue of its time.
One of its goals was to find galaxies hidden behind the Milky Way's zone of avoidance; its data are in the public domain.
Measures
galaxy positions
Telescope
Two 1.3 m telescopes
Site
Mount Hopkins, Arizona and Cerro Tololo, Chile
Light
infrared
Sky area
41,253 deg²
Objects
470,992,970 point sources and 1,647,599 extended sources (All-Sky Release)
Led by
Michael Skrutskie
Institutions
University of Massachusetts Amherst, IPAC/Caltech, NASA, National Science Foundation
A telescope hung beneath a giant balloon, launched from McMurdo Station in Antarctica, rode the polar winds around the continent for about two weeks, more than 40 kilometres up. Above most of the atmosphere, it mapped the Big Bang's afterglow sharply enough to measure the typical size of its hot and cold spots. That size revealed the shape of space itself: flat, like a sheet of paper, rather than curved.
A balloon circling Antarctica for about two weeks mapped the first acoustic peak precisely, showing that space is close to geometrically flat.
Flights in 1998 and 2003 (after a 1997 test over North America) flew above 42,000 m on the polar vortex.
Measures
CMB temperature, CMB polarization
Telescope
Balloon-borne millimetre telescope (90, 150, 240, 410 GHz in 1998; 145, 245, 345 GHz in 2003)
Site
Long-duration balloon from McMurdo Station, Antarctica
Image: R. Williams (STScI), the HDF-S Team, and NASA/ESA
Sky area
0.002 deg²
Was the first Hubble Deep Field a lucky patch, or does every direction look the same? In 1998 Hubble repeated the experiment in the southern constellation Tucana, using three instruments at once, one of them sensitive to infrared. The count of faint galaxies matched the northern field, good evidence that the universe looks much the same whichever way you peer.
A southern twin of the Hubble Deep Field in Tucana, observed with three instruments at once to test whether the northern galaxy counts were typical.
Its galaxy counts matched the northern field, supporting the idea that the universe looks the same in every direction.
Measures
galaxy positions, photometric redshifts
Telescope
Hubble Space Telescope (2.4 m), WFPC2, NICMOS and STIS
Over single nights in 1998 and 1999, a balloon from Texas carried a telescope with super-cooled detectors about 40 kilometres up to study the Big Bang's afterglow. The first flight charted a small patch near the constellation Draco, measuring hot and cold spots from a third of the Moon's width to ten times it. Working independently of BOOMERanG, it reached the same answer: space is flat.
Two overnight balloon flights mapped CMB anisotropy on scales from 10 arcminutes to 5 degrees, independently confirming a flat universe alongside BOOMERanG.
The first flight mapped about 0.3% of the sky near Draco from about 40,000 m.
Measures
CMB temperature
Telescope
Balloon-borne millimetre telescope
Site
Columbia Scientific Balloon Facility, Palestine, Texas
Image: S. Perlmutter (Lawrence Berkeley National Laboratory) and NASA
Objects
42
Reach
0.18 < z < 0.83
Saul Perlmutter's team at Berkeley set out to weigh the universe by finding distant exploding stars and seeing how faint they looked. If gravity were braking the expansion, those supernovae should have appeared brighter than they did. Instead the 42 they studied were dimmer, meaning the expansion is speeding up, a result that earned the 2011 Nobel Prize, shared with the rival High-Z team.
A Berkeley-led search for distant exploding stars whose faintness showed that cosmic expansion is speeding up rather than slowing down.
Shared the 2011 Nobel Prize in Physics with the High-z team. Year is when it presented the acceleration evidence (January 1998).
Measures
supernovae
Telescope
multiple, incl. Hubble Space Telescope follow-up
Light
optical
Objects
42 high-redshift Type Ia supernovae (1999 analysis)
Image: Leitch et al. 2002, ApJ 568, 28, Fig. 6: images of the 32 DASI CMB fields
At the South Pole, where the air is thin, cold and dry, a compact array of 13 small horn antennas stared at the Big Bang's afterglow. In 2002 it found that this ancient light is slightly polarised, its waves vibrating a little more in one direction than another, as theory predicted. A year earlier it had given the first measurements of finer details in the pattern of hot and cold spots.
A compact South Pole interferometer that made the first detection of polarization in the cosmic microwave background in 2002.
In 2001 it also gave the first measurements of the second and third acoustic peaks.
Measures
CMB temperature, CMB polarization
Telescope
13-element interferometer, 26–36 GHz
Site
Amundsen–Scott South Pole Station, Antarctica
Light
microwave
Led by
John Carlstrom
Institutions
University of Chicago, National Science Foundation
Part of Infrared Astronomical Satellite (IRAS) all-sky survey
Image: Saunders et al. 2000, MNRAS 317, 55, Fig. 1: sky distribution of 15,431 PSCz galaxies (Aitoff, Galactic)
Objects
15,000
Because the IRAS satellite saw through dust, its catalogue let astronomers pick galaxies almost evenly across the sky. The PSCz team then measured redshifts for about 15,000 of them, covering 84 per cent of the sky. The result was the most complete 3D map of our surroundings in its day, used to work out how nearby matter tugs on the Milky Way and its neighbours.
Redshifts for infrared-selected galaxies across 84% of the sky, the most complete map of the local density field before 2MASS.
Its predecessors QDOT and the 1.2 Jy survey used the same IRAS catalogue at sparser sampling or brighter flux limits.
Image: Abazajian et al. 2009, ApJS 182, 543, Fig. 1 (DR7 imaging and spectroscopy sky coverage)
Objects
1.6 × 10⁶
Sky area
11,663 deg²
Reach
imaging to g ≈ 23; main galaxy sample z ≈ 0.1; LRGs to z ≈ 0.47
In its first eight years the Sloan survey photographed about a quarter of the sky through five colour filters and catalogued some 357 million objects. For nearly a million of the galaxies it then measured the light in detail to work out their distances. Everything went out in public releases built by automated software, a model of open, industrial-scale astronomy that later surveys copied.
Imaged a quarter of the sky in five colours and took spectra of nearly a million galaxies, setting the template for open, pipeline-driven survey astronomy.
DR7 completed the original SDSS goals with spectroscopy over a contiguous 7,500 square degrees of the northern Galactic cap.
Measures
galaxy positions, redshifts, quasars, photometric redshifts, large-scale structure, BAO
Telescope
2.5 m Sloan Foundation Telescope
Site
Apache Point Observatory, New Mexico
Light
optical
Sky area
11,663 deg²
Objects
357 million imaged objects; 1.6 million spectra incl. 930,000 galaxies and 120,000 quasars (DR7)
Reach
imaging to g ≈ 23; main galaxy sample z ≈ 0.1; LRGs to z ≈ 0.47
Image: Sloan Digital Sky Survey, via Wikimedia Commons
Objects
DR20 (2026) adds over 3 million SDSS-V spectra; SDSS-I/II alone took over 1.6 million
A modest 2.5 metre telescope in New Mexico, later joined by a second 2.5 metre telescope in Chile, has been photographing the sky and splitting the light of millions of galaxies, quasars and stars since 2000. Each spectrum tells how far away an object is, so the survey slowly built a three-dimensional map of the universe around us. Across five generations it has become one of the most used datasets in astronomy, all of it released openly.
Five generations of digital imaging and fibre spectroscopy since 2000 that mapped millions of galaxies, quasars and stars.
Its 2005 detection of the baryon acoustic peak in 46,748 luminous red galaxies confirmed a firm prediction of standard cosmology.
Image: The 6dFGS View of the Local Universe. Graphic: H. Jones (AAO), T. Jarrett (IPAC/Caltech); Galactic plane image courtesy of 2MASS
Objects
1.3 × 10⁵
Sky area
17,000 deg²
Reach
median z = 0.053
Australian astronomers fed starlight from a wide-field telescope through bundles of optical fibres, many galaxies at a time, and measured the distances to about 125,000 galaxies across the southern sky. Away from the dusty band of our own Milky Way, they charted the nearby universe over roughly ten times the area of the earlier 2dF survey. The map also recorded how galaxies drift through space, pulled by the mass around them.
Mapped redshifts for about 125,000 galaxies over the southern sky away from the Milky Way plane, charting the nearby universe in near-infrared-selected detail.
It covered roughly ten times the sky area of 2dFGRS; observations ran from May 2001 to January 2006.
Two tiny patches of sky, each about a fifth of the full Moon's area, were stared at by every major space telescope of the early 2000s, from X-rays to infrared. Combining all that light lets astronomers tell how far away tens of thousands of faint galaxies are and what they were doing when the universe was young. Later deep surveys, including CANDELS and JWST's JADES, returned to the same two fields.
Two fields of about 160 square arcminutes each, centred on the Hubble Deep Field North and the Chandra Deep Field South, observed by every great observatory of its time.
Its Hubble imaging covers about 30 times the area of the original Hubble Deep Field; JADES and CANDELS later built on the same fields.
Measures
galaxy positions, photometric redshifts
Telescope
Hubble ACS, Spitzer, Chandra, XMM-Newton, Herschel, plus VLT and Kitt Peak 4 m
Look far enough and you see the afterglow of the Big Bang, light released when the universe was a few hundred thousand years old. For nine years a NASA spacecraft parked beyond the Moon mapped tiny temperature differences in that glow across the whole sky. From those faint ripples astronomers read off the universe's age, 13.77 billion years, and what it is made of, to within a few per cent.
Nine years of full-sky maps that pinned down the age, contents and geometry of the universe to percent precision and established the Lambda-CDM model.
Final results gave an age of 13.77 billion years; the last data release came on 20 December 2012.
Measures
CMB temperature, CMB polarization
Telescope
Twin back-to-back reflectors; five bands from 23 to 94 GHz
Site
Space (Sun–Earth L2)
Light
microwave
Sky area
41,253 deg²
Reach
z ≈ 1100 (last scattering)
Led by
Charles L. Bennett
Institutions
NASA Goddard Space Flight Center, Princeton University, Johns Hopkins University
To see how galaxies were arranged six to nine billion years ago, when the universe was roughly half its present age or younger, astronomers used one of the 10 metre Keck telescopes in Hawaii for about 90 nights. The DEEP2 team measured precise distances for more than 38,000 faint galaxies in four small fields. When finished it was the most detailed census of galaxies from that era.
Took high-resolution spectra of galaxies around redshift one in four small fields, the densest precision census of galaxies at that epoch when completed.
It used about 90 nights on Keck; observations began in 2002.
A huge digital camera called MegaCam spent about 450 nights over five years on a Hawaiian telescope, photographing patches of sky at different depths. Some fields went very deep to catch distant exploding stars, others went wide to measure the tiny distortions in galaxy shapes caused by intervening mass. Its images fed much of the 2000s research on dark energy and galaxy growth, and later surveys reused them.
A five-year MegaCam programme of deep, wide and very wide layers that seeded weak lensing, supernova and galaxy evolution studies of the 2000s.
About 450 nights went into the survey; its Wide layer spans four patches, W1 to W4, from 171 pointings.
Image: Bianchi, Conti & Shiao 2014, Advances in Space Research 53, 900 (arXiv:1312.3281), Fig. 3
Reach
All-sky survey m_AB ≈ 20.5; medium (1,000 deg²) ≈ 23; deep (100 deg²) ≈ 25; star formation history to z ≈ 1.5
Hot young stars shine brightly in ultraviolet light, which Earth's atmosphere blocks. GALEX, a small NASA telescope in orbit, photographed the sky in two ultraviolet colours to see where and how fast galaxies were making new stars, from today back to about nine billion years ago. Planned to last 29 months, it kept working for about a decade until it was switched off in 2013.
A NASA small explorer that surveyed the sky in two ultraviolet bands, tracing star formation across most of cosmic history.
Planned for 29 months, it ran about ten years; Caltech operated it for its final year before deactivation on 28 June 2013.
Measures
galaxy positions
Telescope
GALEX 50 cm Ritchey–Chrétien telescope
Site
Space (low Earth orbit)
Light
ultraviolet
Reach
All-sky survey m_AB ≈ 20.5; medium (1,000 deg²) ≈ 23; deep (100 deg²) ≈ 25; star formation history to z ≈ 1.5
Led by
D. Christopher Martin
Institutions
California Institute of Technology, NASA Jet Propulsion Laboratory
Point Hubble at an apparently empty speck of sky, about a tenth of the full Moon's width, and keep looking for 400 orbits. That is what astronomers did in 2003 and 2004, and the speck turned out to hold an estimated 10,000 galaxies, some seen as they were less than a billion years after the Big Bang. Released in 2004, it was the deepest visible-light picture of the universe yet taken.
About 11 square arcminutes in Fornax, exposed for nearly a million seconds, giving the deepest visible-light view of the universe at the time.
Built from 400 orbits between September 2003 and January 2004 and released on 9 March 2004.
Image: SWIRE view of one-sixteenth of the ELAIS-N1 field (PIA03543, fig. 2). NASA/JPL-Caltech
Objects
2.0 × 10⁶
Sky area
65 deg²
Dust hides much of the star formation in galaxies, but it glows in infrared light. NASA's Spitzer Space Telescope mapped seven patches of sky totalling about 65 square degrees in all of its infrared bands to find these hidden galaxies in large numbers. The goal was to see how dusty, star-forming galaxies and their surroundings changed over most of cosmic history.
The largest Spitzer Legacy extragalactic survey: seven high-latitude fields totalling 60 to 65 square degrees in all seven Spitzer bands.
It was planned to find about 150,000 luminous infrared galaxies, some 7,000 of them beyond redshift 2.
Measures
galaxy positions, large-scale structure
Telescope
Spitzer Space Telescope (0.85 m), IRAC and MIPS
Site
Space (Earth-trailing heliocentric orbit)
Light
infrared
Sky area
65 deg²
Objects
over 2 million infrared-selected galaxies expected
Image: Sky distribution of ALFALFA HI sources (spring sky), from Haynes et al. 2018, ApJ 861, 49 (arXiv:1805.11499), Fig. 1
Objects
31,500
Sky area
7,000 deg²
Reach
z < 0.06
Cold hydrogen gas, the raw fuel for stars, gives off a faint radio signal at a wavelength of 21 centimetres. Martha Haynes and Riccardo Giovanelli used the giant Arecibo dish in Puerto Rico to sweep about a sixth of the sky for it, without picking targets in advance. The result, some 31,500 gas-rich galaxies, is the largest such census of the nearby universe, including faint galaxies that are mostly gas and few stars.
A blind 21 cm survey of about 7,000 square degrees with the Arecibo dish, the largest census of gas-rich galaxies in the nearby universe.
Observing ran from February 2005 to October 2012, about 4,400 hours of telescope time.
Measures
neutral hydrogen, redshifts
Telescope
Arecibo 305 m telescope with the ALFA multibeam receiver
Image: Science: NASA, ESA, Adam G. Riess (STScI, JHU)
Objects
42
Reach
Local distance ladder anchored on Milky Way parallaxes, the LMC and the maser galaxy NGC 4258
How fast is the universe expanding today? Adam Riess and his team answer with a chain of cosmic yardsticks: pulsating stars whose true brightness is known, observed by Hubble in the same galaxies as exploding stars that can be seen much farther away. Their result, about 73 kilometres per second for every 3.26 million light-years, disagrees with the value predicted from the Big Bang's afterglow, a puzzle now called the Hubble tension.
A Hubble programme that ties Cepheid stars to Type Ia supernovae in the same galaxies to measure the local expansion rate with about 1 percent precision.
It found H0 = 73.04 ± 1.04 km/s/Mpc, a 5-sigma difference from the value predicted by Planck plus ΛCDM: the Hubble tension.
Measures
Cepheid distances, supernovae, Hubble constant
Telescope
Hubble Space Telescope (2.4 m), NICMOS then WFC3
Site
Space (low Earth orbit)
Light
multi
Objects
42 Type Ia supernovae in 37 host galaxies at z < 0.01 (Riess et al. 2022)
Reach
Local distance ladder anchored on Milky Way parallaxes, the LMC and the maser galaxy NGC 4258
Led by
Adam G. Riess
Institutions
Space Telescope Science Institute, Johns Hopkins University
Image: Knobel et al. 2012, ApJ 753, 121, Fig. 7 (zCOSMOS 20k groups in redshift space)
Objects
20,000
Sky area
1.7 deg²
Reach
bright 0.1 < z < 1.2; deep 1.4 < z < 3.0
Using an 8 metre telescope in Chile for 600 hours, zCOSMOS measured the distances of tens of thousands of galaxies in one small, intensively studied patch of sky. With distances in hand, astronomers could see whether each galaxy lived alone, in a group or along a filament, back to when the universe was about two billion years old. The question was how a galaxy's surroundings shape the way it grows.
A 600-hour VLT survey of the COSMOS field that traced galaxy environments from groups to the cosmic web out to redshift three.
zCOSMOS-bright was designed to mimic the 2dFGRS parameters, but at redshifts up to 1.2.
Image: BICEP2 E-mode and B-mode maps with lensed-ΛCDM simulations, from BICEP2 Collaboration (Ade et al.) 2014, PRL 112, 241101 (arXiv:1403.3985)
If the universe went through a split second of explosive growth at birth, called inflation, it should have sent ripples through space that left a faint swirling pattern in the polarisation of the Big Bang's afterglow. A series of small telescopes at the South Pole has been hunting that pattern since 2006. A 2014 claim of detection turned out to be dust in our own galaxy, and the search now sets ever tighter limits.
A series of South Pole telescopes hunting the B-mode polarization pattern that gravitational waves from inflation would leave on the CMB.
BICEP2's 2014 claimed detection was shown in 2015 to be Milky Way dust; the 2021 limit is r < 0.036.
Caltech, Harvard-Smithsonian Center for Astrophysics, Stanford University, University of Minnesota, NASA JPL, University of Chicago, Cardiff University
Image: Drinkwater et al. 2010, MNRAS 401, 1429, Fig. 21 (WiggleZ 15-hr region cone)
Objects
2.0 × 10⁵
Sky area
1,000 deg²
Reach
90% of galaxies at 0.2 < z < 1.0
Galaxies that glow brightly in ultraviolet light are busy making stars, and NASA's GALEX images made them easy to pick out. WiggleZ then measured distances to more than 200,000 of them with the Anglo-Australian Telescope, to read the faint preferred spacing between galaxies left by sound waves in the young universe, 4 to 8 billion years back in time. Many targets turned out to be colliding or distorted galaxies.
Targeted starburst galaxies picked from GALEX ultraviolet images to measure the baryon acoustic scale 4 to 8 billion years back in time.
Its target galaxies turned out to be mostly extreme starbursts, many interacting or distorted in Hubble images.
Image: ACT DR6 CMB lensing mass map, from Madhavacheril et al. 2024, ApJ 962, 113 (arXiv:2304.05203)
Sky area
19,000 deg²
High in Chile's Atacama Desert, at about 5,190 metres, a 6 metre telescope mapped the Big Bang's afterglow in fine detail across nearly half the sky. Besides the faint ripples themselves, it saw how massive galaxy clusters slightly alter that ancient light as it passes through their hot gas. That way it found the huge cluster nicknamed El Gordo and first detected, statistically, the motions of clusters through space.
A high-altitude 6 m telescope that mapped the microwave sky at arcminute resolution, measuring small-scale CMB power, lensing and Sunyaev-Zeldovich clusters.
ACT found the massive 'El Gordo' cluster and made the first statistical detection of cluster motions via the kinematic SZ effect.
Image: NASA/ESA/Richard Massey (California Institute of Technology)
Objects
1.7 × 10⁶
Sky area
2 deg²
Reach
z > 0.5 to 6 (overview); COSMOS2020 to z ≈ 10
One patch of sky in the constellation Sextans, about ten times the area of the full Moon, has been photographed by almost every major telescope, from X-rays to radio waves. It is big enough to contain whole stretches of the cosmic web as well as some 1.7 million catalogued sources. In 2007 its Hubble images produced the first three-dimensional map of dark matter, the invisible mass that outweighs ordinary matter.
A 2-square-degree field in Sextans imaged from X-ray to radio, large enough to sample cosmic structure as well as galaxy evolution.
In 2007 it yielded the first three-dimensional map of dark matter, reconstructed from weak lensing of Hubble galaxies.
Image: SPT-3G D1 CMB temperature map of the Main field compared with Planck, from Quan et al. 2026 (arXiv:2603.20163)
Objects
677
Sky area
2,500 deg²
Reach
clusters to z > 1.4
Light from the Big Bang has travelled for nearly 14 billion years, and when it crosses the hot gas inside a galaxy cluster it leaves a small dimming, a kind of shadow. A 10 metre telescope at the South Pole searches for those shadows, which look about the same whether a cluster is nearby or very far away. Its 2,500 square degree survey alone turned up 677 cluster candidates, many of them very distant.
A 10 m telescope at the South Pole that finds distant galaxy clusters by their shadow on the microwave background, nearly independent of redshift.
The 2,500 deg² SPT-SZ survey found 677 cluster candidates with a median redshift of 0.55.
Image: Sanders et al. 2007, ApJS 172, 86, Fig. 4: IRAC 3.6 µm mosaic of the whole S-COSMOS field with zoom
Sky area
2 deg²
Reach
L* disks and spheroids to z ≈ 3 (IRAC)
Spitzer's contribution to COSMOS: the space telescope imaged the whole COSMOS field in seven infrared bands, from near to far infrared. Infrared light reveals stars hidden by dust and the warm glow of dust heated by young stars or feeding black holes. The survey was built to catch the most intensely star-forming galaxies and active black holes out to when the universe was about two billion years old.
Spitzer's Legacy survey of the full 2-square-degree COSMOS field in seven infrared bands from 3.6 to 160 microns.
It was designed to detect ultraluminous starbursts and active galactic nuclei out to redshift about 3 at 24 microns.
Image: Dawson et al. 2013, AJ 145, 10, Fig. 1 (BOSS footprint, 2208 plate centres)
Objects
1.2 × 10⁶
Sky area
10,000 deg²
Reach
galaxies z < 0.7; Lyman-alpha forest 2.15 < z < 3.5
Sound waves rippling through the young universe left a preferred spacing between galaxies, about 500 million light-years, that can serve as a giant ruler. BOSS, part of the Sloan survey, measured 1.2 million massive galaxies, plus the shadows of hydrogen clouds in the light of distant quasars, to read that ruler at many distances. It pinned the scale to about one per cent and so tracked how the universe's expansion has changed.
Part of SDSS-III, it mapped 1.2 million luminous galaxies and the hydrogen absorption in quasar light to measure the baryon acoustic scale to about one per cent.
It made the first detection of large-scale 3D clustering in the Lyman-alpha forest. Years shown are those of SDSS-III.
Image: H. M. Courtois, R. van de Weygaert, M. Aubert, D. Pomarède, D. Guinet, J. Domínguez-Gómez et al.
Objects
1,797
Reach
cz < 3,000 km/s (CF1)
Besides riding the expansion of the universe, galaxies drift, pulled by nearby concentrations of mass. Brent Tully and Hélène Courtois are building a catalogue of galaxy distances measured independently of that expansion, so the leftover motions can be mapped. Their first analysis showed our Local Group is being pushed away from a nearby empty region, the Local Void, at about 259 km/s.
A growing database of independent galaxy distances that reveals how galaxies stream through the local universe, beyond what the Hubble expansion alone predicts.
Its first analysis split our Local Group motion into three parts, including a 259 km/s push away from the Local Void.
In a few chosen patches of sky, GAMA tried to miss almost nothing: it measured distances for about 95 per cent of all galaxies down to a fixed brightness. That thoroughness matters for small galaxies sitting next to big ones, which other surveys often skip. With such a complete map, astronomers could study groups, mergers and how galaxies have built up their stars over the last few billion years.
A highly complete redshift survey over five sky regions, built to study galaxy groups, mergers and how stellar mass is assembled in the nearby universe.
It reached 95 per cent completeness to r = 19.65, the highest redshift density over such a sustained area.
Image: Guzzo et al. 2014, A&A 566, A108, Fig. 16 (VIPERS W1 cone, coloured by rest-frame colour)
Objects
86,775
Sky area
23.5 deg²
Reach
0.5 < z < 1.2; i_AB < 22.5
To picture the galaxy map when the universe was roughly half its present age, VIPERS used an 8 metre telescope in Chile to measure distances to about 87,000 galaxies from that era, sampling them almost as densely as surveys of the nearby universe do. It let astronomers compare structure then and now, and test how gravity pulls galaxies together over time.
An ESO Large Programme that mapped about 87,000 galaxies when the universe was roughly half its age, with sampling close to local surveys.
It ran from November 2008 to December 2014 inside the CFHTLS-Wide W1 and W4 fields.
Some of the busiest star-forming galaxies are wrapped in dust that hides them from optical telescopes but glows in far-infrared light. ESA's Herschel telescope spent 600 hours mapping about 550 square degrees at those wavelengths, around four times the area of all its other surveys combined. It was expected to find about a quarter of a million such galaxies, some seen when the universe was young.
The largest Herschel extragalactic survey, mapping about 550 square degrees at 100 to 500 microns to find dusty, star-forming galaxies.
It received 600 hours of Herschel time and covers about four times the area of all other Herschel surveys combined.
Measures
galaxy positions
Telescope
Herschel Space Observatory (3.5 m), PACS and SPIRE
ESA's Planck satellite mapped the Big Bang's afterglow across the whole sky in nine colours of microwave light, with three times the sharpness of WMAP. Its maps gave the most precise recipe yet for the universe: how old it is, what it contains and how fast it should be expanding. That predicted expansion rate, 67.4 kilometres per second for every 3.26 million light-years, sits below what nearby measurements find, one of today's biggest open puzzles.
ESA's mission mapped the microwave sky in nine bands with three times WMAP's resolution, giving the reference cosmological parameters used across modern cosmology.
Its 2018 legacy release gave H0 = 67.4 ± 0.5 km/s/Mpc, in tension with local distance-ladder measurements.
Image: CSST Collaboration 2025, Introduction to the Chinese Space Station Survey Telescope (CSST), arXiv:2507.04618, Fig. 4
Sky area
17,500 deg²
China is building a 2 metre space telescope, Xuntian, that will fly alongside its Tiangong space station, with a field of view about 300 times Hubble's at similar sharpness. Planning began in 2010 and launch is planned for 2027. It is meant to photograph some 40 per cent of the sky to map dark matter and the large-scale arrangement of galaxies.
A planned Chinese space telescope that will image about 40 percent of the sky in seven bands and three slitless spectroscopy bands for weak lensing and clustering.
Its field of view is about 300 times Hubble's at similar resolution; launch is planned for 2027 on a Long March 5B. The year shown, 2010, is when planning began.
Image: NASA, ESA, A. van der Wel (MPIA), H. Ferguson and A. Koekemoer (STScI), and the CANDELS team
Objects
2.5 × 10⁵
Sky area
0.22 deg²
Reach
z ≈ 1.5 to 8; 5σ H = 27.7 (deep) and ≳ 27.0 (wide)
With 902 orbits, roughly 60 days of continuous observing, CANDELS was the largest Hubble programme of its day. It used Hubble's infrared camera on five well-studied fields to follow how more than 250,000 galaxies grew, from the first billion years up to the busiest era of star formation. It also caught distant exploding stars along the way.
The largest Hubble programme of its time: near-infrared imaging of five well-studied fields, about 800 square arcminutes, to follow galaxy growth from cosmic dawn to noon.
It used 902 Hubble orbits, roughly 60 days of continuous observing.
Image: R. White (STScI) and the PS1 Science Consortium
Reach
3π stack 5σ: g 23.3, r 23.2, i 23.1, z 22.3, y 21.4
From a mountaintop on Maui, a 1.8 metre telescope with an enormous digital camera photographed three quarters of the sky about a dozen times each, in five colours. Stacking the repeated images made a deep, uniform map of billions of stars and galaxies. When the data were released in 2016 they were described as the largest digital sky survey ever made public.
Imaged the whole sky north of declination minus 30 degrees about 12 times in five bands, then released it publicly through MAST.
Its December 2016 data release was billed as the largest digital sky survey ever released to the world.
Measures
galaxy positions, photometric redshifts
Telescope
1.8 m Pan-STARRS1 telescope
Site
Haleakalā Observatory, Maui, Hawaii
Light
optical
Reach
3π stack 5σ: g 23.3, r 23.2, i 23.1, z 22.3, y 21.4
Led by
Kenneth C. Chambers
Institutions
University of Hawaii Institute for Astronomy, Space Telescope Science Institute (MAST)
5σ better than 0.08, 0.11, 1 and 6 mJy at 3.4, 4.6, 12 and 22 μm
NASA's WISE spacecraft photographed the entire sky in four infrared colours in 2010, catching objects too cool or too dusty to show up well in visible light. Astronomers later stacked its images, and those of its NEOWISE extension, into deeper all-sky maps called unWISE, used to chart distant galaxies and quasars across the sky. The spacecraft ended its mission in 2024 and burned up in the atmosphere that November.
Mapped the whole sky in four mid-infrared bands; the unWISE coadds later combined its images into deeper all-sky maps used for large-scale structure.
First full-sky coverage was completed on 17 July 2010; reborn as NEOWISE, the craft ended its mission in August 2024 and re-entered on 1 November 2024.
Measures
galaxy positions, quasars, large-scale structure
Telescope
WISE 40 cm infrared telescope
Site
Space (low Earth orbit, Sun-synchronous)
Light
infrared
Sky area
41,253 deg²
Reach
5σ better than 0.08, 0.11, 1 and 6 mJy at 3.4, 4.6, 12 and 22 μm
Image: ESA/XMM-Newton/XXL survey consortium/(S. Snowden, L. Faccioli, F. Pacaud)
Objects
100 clusters in the bright sample
Sky area
50 deg²
Galaxy clusters, the largest objects held together by gravity, are full of gas so hot it shines in X-rays. The XXL survey used ESA's XMM-Newton space telescope to map two fields totalling 50 square degrees, deep enough to find clusters well beyond the reach of earlier X-ray surveys. Counting clusters and weighing them tests how fast cosmic structure has grown.
The largest XMM-Newton survey, 50 square degrees in two fields mapped deep enough to trace galaxy clusters well beyond ROSAT's reach.
Its bright cluster sample of 100 systems has spectroscopic redshifts for 97. The year shown, 2010, is when its XMM-Newton time was approved.
Image: Kilo-Degree Survey Collaboration/H. Hildebrandt & B. Giblin/ESO
Sky area
1,347 deg²
Reach
lensing sample to photometric z ≤ 2.0 (KiDS-Legacy)
Mass bends light, so the images of distant galaxies are very slightly stretched by the matter in front of them. KiDS measured that tiny stretching in the shapes of millions of galaxies over about 1,350 square degrees to weigh how clumpy the universe's matter is. Early results suggested less clumping than Planck predicts; the final 2025 analysis brought the two into agreement.
A nine-band optical and near-infrared survey built for weak lensing, whose results first sharpened then eased the S8 tension with the CMB.
KiDS-1000 found S8 about 8 per cent below Planck; the full KiDS-Legacy analysis in 2025 agrees with Planck to 0.73 sigma.
Image: Near-infrared sky from 2MASS, galaxies colour-coded by redshift. IPAC/Caltech, by Thomas Jarrett
Objects
44,599
Reach
structures within ≈300 Mpc
Starting from the brightest galaxies in the 2MASS infrared sky survey, John Huchra and colleagues measured distances for about 44,600 of them across nearly the whole sky. Infrared light passes through much of our own galaxy's dust, so the map reaches closer to the Milky Way's plane than optical surveys can, out to about a billion light-years. It became the most complete three-dimensional map of our cosmic neighbourhood, published after Huchra's death in 2010.
Redshifts for the brightest 2MASS galaxies over 91% of the sky, the most complete three-dimensional map of the nearby universe at release.
About 11,000 spectra were taken new; the catalogue is 97.6% complete to its limits. John Huchra died in 2010, before publication.
The CFHTLenS team did not trust existing images: they went back to the raw data from the Canada-France-Hawaii Legacy Survey and rebuilt every processing step to measure the faint distortions of galaxy shapes caused by intervening matter. To avoid fooling themselves, they checked everything while the cosmological answer was still hidden from them. The result was one of the first catalogues of that kind ready for precise cosmology.
Reprocessed the CFHTLS-Wide images from raw pixels to deliver one of the first science-ready cosmic shear and photometric redshift catalogues.
Every step of the pipeline was rebuilt and tested with cosmology-insensitive checks before results were unblinded. Year is the release.
Image: NASA, ESA, G. Illingworth, D. Magee, and P. Oesch (UC Santa Cruz), R. Bouwens (Leiden University), and the HUDF09 Team
Objects
5,500
Sky area
0.001 deg²
Reach
5σ 29.1–30.3 AB per filter; 31.2 AB in the deepest combined image
Take ten years of Hubble pictures of the same small patch of the Ultra Deep Field, about two million seconds of exposure in all, and add them together. The eXtreme Deep Field, released in 2012, is the result: about 5,500 galaxies in a view smaller than the original, some seen as they were 13.2 billion years ago. It was the deepest optical and near-infrared picture yet assembled.
Ten years of Hubble images of the Ultra Deep Field stacked into one, the deepest optical and near-infrared view yet assembled.
About two million seconds of exposure; its oldest galaxies are seen as they were 13.2 billion years ago.
Measures
galaxy positions, photometric redshifts
Telescope
Hubble Space Telescope (2.4 m), ACS and WFC3/IR
Site
Space (low Earth orbit)
Light
multi
Sky area
0.001 deg²
Objects
about 5,500 galaxies (release); 14,140 sources in the full catalogue
Reach
5σ 29.1–30.3 AB per filter; 31.2 AB in the deepest combined image
Led by
Garth D. Illingworth
Institutions
University of California, Santa Cruz, Leiden University
Image: H. M. Courtois, R. van de Weygaert, M. Aubert, D. Pomarède, D. Guinet, J. Domínguez-Gómez et al.
Objects
8,188
Reach
sparse sampling to z = 0.1
A catalogue of how far away some 8,000 nearby galaxies really are, gathered by R. Brent Tully, Hélène Courtois and colleagues. Distance is the hard part in astronomy, so they read it from how fast a galaxy spins or how quickly its stars move, which reveals how bright it truly is. With true distances in hand, each galaxy's own drift through space can be separated from the general expansion of the universe.
Expanded the Cosmicflows distance catalogue to more than 8,000 galaxies, mostly from the Tully-Fisher and Fundamental Plane relations.
Its distances implied a Hubble constant of 74.4 ± 3.0 km/s/Mpc.
Image: N. Jeffrey; Dark Energy Survey Collaboration
Objects
6.9 × 10⁸
Sky area
5,000 deg²
Reach
coadd i ≈ 23.8 (S/N 10)
A wide camera on a telescope in the Chilean Andes photographed one eighth of the sky over 758 nights and six seasons, to find out what dark energy is: the unknown something that makes the universe's expansion speed up. The team tested it four ways from one set of images, through how galaxies cluster, how their shapes are faintly warped by matter in front of them, how many giant galaxy clusters there are, and how distant exploding stars fade.
Imaged an eighth of the sky over 758 nights to measure dark energy with lensing, clustering, galaxy clusters and supernovae from one dataset.
Its Year 6 analysis finds S8 = 0.789 ± 0.012, 2.6 sigma below CMB-based predictions when projected onto S8 alone.
Image: NASA, ESA, and J. Lotz, M. Mountain, A. Koekemoer, and the HFF Team (STScI)
Objects
12
Reach
about 29 AB (5σ) in parallels; intrinsic 30–33 mag behind cluster lenses
Hubble spent more than 840 orbits staring at six huge clusters of galaxies, each so massive that its gravity bends and magnifies the light of galaxies far behind it, like a lens made of mass. Through these natural magnifying glasses, astronomers could see galaxies too faint and too young to catch any other way. Six emptier patches of sky beside the clusters were imaged at the same time for comparison.
Used six massive galaxy clusters, including Abell 2744 and Abell 370, as natural magnifying glasses to see fainter, earlier galaxies behind them.
Lensing magnifies background galaxies by a few times, and 10 to 100 times near the critical curves; over 840 Hubble orbits were spent.
Measures
galaxy positions, weak lensing, galaxy clusters
Telescope
Hubble ACS and WFC3, with Spitzer IRAC
Site
Space
Light
multi
Objects
6 lensing clusters plus 6 parallel blank fields
Reach
about 29 AB (5σ) in parallels; intrinsic 30–33 mag behind cluster lenses
Image: Springob et al. 2014, MNRAS 445, 2677, Fig. 11: smoothed 6dFGSv peculiar velocity field in supergalactic coordinates
Objects
8,885
Reach
z < 0.055 (cz ≈ 16,000 km/s)
Elliptical galaxies, the round ones made of old stars, follow a tidy rule: the speed of their stars and their surface brightness give their true size, and comparing that with how big they look gives their distance. An Australian-led team applied the rule to nearly 8,900 southern galaxies from the 6dF Galaxy Survey. Set against how fast each one seems to recede, the distances show which galaxies are being tugged by the mass around them.
Used the Fundamental Plane of elliptical galaxies to turn 6dFGS spectra into distances and peculiar velocities for about 8,900 galaxies in the southern sky.
Galaxies toward the Shapley and Vela superclusters move outward faster than density-field models predicted. Year given is the velocity-catalogue publication.
Measures
peculiar velocities, galaxy positions
Telescope
1.2 m UK Schmidt Telescope (6dFGS data)
Site
Siding Spring Observatory, Australia
Light
optical
Objects
8,885 early-type galaxies with Fundamental Plane distances
Reach
z < 0.055 (cz ≈ 16,000 km/s)
Led by
Christopher M. Springob, Christina Magoulas, Matthew Colless, Jeremy Mould
Image: Dey et al. 2019, AJ 157, 168 (arXiv:1804.08657), Fig. 1
Sky area
14,000 deg²
Before DESI could collect the light of millions of galaxies, someone had to decide which ones to point at. Three telescopes in Arizona and Chile photographed 14,000 square degrees, about a third of the sky, in three colours, and the result became the target list for DESI's robotic fibres. The images are public and now also serve as a sky atlas for other research.
Three coordinated imaging surveys that photographed 14,000 square degrees in g, r and z to choose the galaxies and quasars DESI would observe.
Exposure times were adjusted live during observing to give nearly uniform depth; later releases model about 31,000 square degrees.
LRGs median z = 0.72; quasars 0.9 < z < 2.2 and Lyman-alpha forest above
The fourth Sloan programme pointed its 2.5-metre telescope in New Mexico at more distant galaxies and at quasars, the blazing cores of far-off galaxies, to fill the stretch of cosmic history that earlier maps had skipped. Spread through those maps is a faint pattern left by sound waves in the young universe, a cosmic yardstick for how fast space expanded. With two decades of Sloan data, that yardstick rules out a universe without dark energy beyond reasonable doubt.
The SDSS-IV cosmology survey that filled the redshift gap between BOSS galaxies and the Lyman-alpha forest, completing two decades of Apache Point clustering maps.
Combined SDSS BAO data alone rule out dark-energy-free models at more than eight standard deviations. Years shown are those of SDSS-IV.
Milky Way and Local Group; anchors the first rung of the distance ladder
Europe's Gaia spacecraft spent more than a decade measuring the positions of almost two billion stars again and again, so precisely that it could see them shift as Earth circles the Sun. That small yearly wobble, called parallax, gives distance by pure geometry, the same trick our two eyes use to judge depth. Those distances form the first rung of the ladder astronomers climb to measure the size and expansion of the universe.
ESA's astrometry mission measured positions, distances and motions of over a billion Milky Way stars, giving geometric parallaxes that calibrate the cosmic distance ladder.
Launched 19 December 2013, it ended science observations on 15 January 2025 and was passivated on 27 March 2025.
Measures
parallaxes, proper motions, Cepheid distances
Telescope
Gaia astrometric spacecraft
Site
Space (Sun–Earth L2)
Light
optical
Sky area
41,253 deg²
Objects
about 1.8 billion sources (DR3, 2022)
Reach
Milky Way and Local Group; anchors the first rung of the distance ladder
Institutions
European Space Agency, Gaia Data Processing and Analysis Consortium (DPAC)
Japan's 8.2-metre Subaru Telescope on Maunakea carries a giant camera, Hyper Suprime-Cam, and for 330 nights between 2014 and 2022 it photographed about 1,100 square degrees, the area of more than 5,000 full Moons, down to very faint galaxies. The goal was to measure the tiny, shared distortions that unseen dark matter imprints on the shapes of distant galaxies. Along the way it catalogued more than half a billion objects.
A 330-night, three-layer imaging survey on the 8.2-metre Subaru Telescope, reaching about magnitude 26 over roughly 1,100 square degrees for weak lensing and galaxy studies.
It started in March 2014; the last observing night was 3 January 2022.
Image: LoTSS-DR2 coverage and image noise across the northern sky, from Shimwell et al. 2022, A&A 659, A1 (arXiv:2202.11733)
Objects
4.4 × 10⁶
Sky area
5,635 deg²
LOFAR is a radio telescope with no dish: thousands of simple antennas spread across the Netherlands and other European countries, combined by computer into one instrument. Tuned to low radio frequencies, with waves about two metres long, it is surveying the northern sky. Its second data release alone holds more than four million sources, mostly galaxies with feeding black holes or busy star formation, many of them never detected before.
A low-frequency survey of the northern sky at 6 arcsecond resolution, detecting millions of radio galaxies and star-forming galaxies, many never seen before.
Data release 2 covers 27% of the northern sky in two regions of 4,178 and 1,457 square degrees.
Measures
galaxy positions, large-scale structure
Telescope
Low Frequency Array (LOFAR), 120–168 MHz
Site
LOFAR, core in the Netherlands with stations across Europe
Light
radio
Sky area
5,635 deg²
Objects
4,396,228 radio sources (DR2)
Led by
Timothy Shimwell, Martin Hardcastle, Cyril Tasse, Philip Best, Huub Röttgering
Image: H. M. Courtois, R. van de Weygaert, M. Aubert, D. Pomarède, D. Guinet, J. Domínguez-Gómez et al.
Objects
17,669
The third edition of the Tully and Courtois galaxy distance catalogue, now with Jenny Sorce, roughly doubled the count to nearly 17,700 galaxies. Infrared images from the Spitzer Space Telescope sharpened distances based on how fast galaxies spin, and the Australian 6dF survey added nearly 9,000 elliptical galaxies in the southern sky. Mapped together, the distances trace the currents of motion that carry our own galaxy and its neighbours through space.
Doubled the catalogue by adding Spitzer-based Tully-Fisher distances and 8,885 6dFGS Fundamental Plane distances.
It gave a Hubble constant of 76.2 ± 3.4 (random) ± 2.7 (systematic) km/s/Mpc from supernova calibration.
Measures
peculiar velocities
Telescope
compilation incl. Spitzer 3.6 µm photometry and 6dFGS
Light
multi
Objects
17,669 galaxy distances
Led by
R. Brent Tully, Hélène M. Courtois, Jenny G. Sorce
Instead of choosing galaxies first and then measuring them, the 10-metre Hobby-Eberly Telescope in Texas spread tens of thousands of fibres across the sky and recorded whatever light fell on them, about 600 million spectra in all. Hidden in that haystack are galaxies glowing in one particular colour of hydrogen light, seen as they were 10 to 11 billion years ago. Their positions reveal how fast the universe was expanding back then.
Pointed thousands of fibres at the sky without choosing targets first, catching Lyman-alpha galaxies to measure cosmic expansion 10 to 11 billion years ago.
The HETDEX database holds about 600 million spectra; observing ended in August 2024.
Measures
redshifts, galaxy positions, BAO
Telescope
10 m Hobby-Eberly Telescope, VIRUS integral-field spectrographs
Site
McDonald Observatory, Texas
Light
optical
Sky area
540 deg²
Objects
goal: over a million Lyman-alpha emitters; PDR1 catalogue holds 426,654
Reach
1.88 < z < 3.52
Led by
Karl Gebhardt
Institutions
University of Texas at Austin / McDonald Observatory
Image: Gwyn et al. 2025, UNIONS: The Ultraviolet Near-Infrared Optical Northern Survey, arXiv:2503.13783, Fig. 1
Sky area
6,250 deg²
Reach
10σ: u 23.7, g 24.5, r 24.2, i 23.8, z 23.3
Several teams using telescopes on Maunakea and Haleakalā in Hawaii pooled their observing time to photograph about 6,250 square degrees of the northern sky in five colours, from near-ultraviolet to near-infrared. The images record the faint warping of distant galaxies by dark matter, and their colours give each galaxy a rough distance. They also supply the northern ground-based data that the Euclid space telescope needs to calibrate its own measurements.
A 'collaboration of collaborations' imaging 6,250 square degrees of the northern sky in five bands, a northern complement to Rubin and support for Euclid.
It supplies the northern data Euclid needs to calibrate its point-spread function and photometric redshifts. Start year not stated in sources.
Image: Sky positions of 3,558 non-repeating and 83 repeating fast radio burst sources, coloured by extragalactic dispersion measure, from the CHIME/FRB Collaboration 2026, The Second CHIME/FRB Catalog of Fast Radio Bursts (arXiv:2601.09399), Fig. 1
Objects
3,641
Reach
0.8 < z < 2.5 (21 cm design range)
CHIME looks like four giant half-pipes, each 100 metres long, lying in a valley in British Columbia. It has no moving parts: as the Earth turns, the whole northern sky drifts overhead every day, and computers combine the signals of its 1,024 antennas. It was built to map the faint radio glow of hydrogen gas across billions of years without picking out single galaxies, and it turned out to be the world's best catcher of fast radio bursts, brief flashes from distant galaxies, finding thousands of them.
A drift-scan radio interferometer that maps neutral hydrogen by intensity mapping over 0.8 < z < 2.5 and has catalogued 4,539 fast radio bursts from 3,641 sources.
In 2023 it made the first 21 cm intensity-mapping detection with an interferometer, by stacking its maps on eBOSS galaxies and quasars between z = 0.78 and 1.43.
Measures
neutral hydrogen, large-scale structure, fast radio bursts
Telescope
four 100 m × 20 m cylindrical reflectors with 1,024 dual-polarisation feeds, 400–800 MHz, no moving parts
Site
Dominion Radio Astrophysical Observatory, near Penticton, British Columbia
Light
radio
Objects
4,539 fast radio bursts from 3,641 sources (Second CHIME/FRB Catalog, 2018–2023)
Reach
0.8 < z < 2.5 (21 cm design range)
Institutions
University of British Columbia, McGill University, University of Toronto, National Research Council of Canada (DRAO)
From Palomar Observatory in California, a wide camera sweeps the northern sky every few nights, looking for anything that changes. Among its catches are thousands of Type Ia supernovae, exploding stars that all peak at nearly the same brightness and so work as distance markers. The 3,628 nearby examples found between 2018 and 2020 form the close-range baseline against which distant supernovae, and so dark energy, are measured.
A fast wide-field transient survey that built the largest homogeneous sample of nearby Type Ia supernovae, the low-redshift anchor for dark energy studies.
DR2 increased the number of well-characterised low-redshift Type Ia supernovae by an order of magnitude.
Measures
supernovae
Telescope
48-inch Samuel Oschin Schmidt telescope, 47 deg² ZTF camera
Site
Palomar Observatory, California
Light
optical
Objects
3,628 Type Ia supernovae (DR2, 2018–2020)
Reach
z < 0.3
Led by
Shrinivas R. Kulkarni, Eric C. Bellm, Mickael Rigault
Image: eROSITA/MPE/IKI/J. Sanders/H. Brunner/E. Churazov/M. Gilfanov & eSASS team
Objects
9.0 × 10⁵
Sky area
20,627 deg²
A German X-ray telescope aboard a Russian-German spacecraft scanned the whole sky four times between 2019 and 2022, catching the glow of gas heated to millions of degrees inside clusters of galaxies. Counting how many of these giants exist at different distances shows how fast cosmic structure has grown, a test of dark energy. The German half of the sky alone yielded about 900,000 X-ray sources, including some 12,000 clusters.
The deepest X-ray map of the whole sky, built to measure dark energy through the growth of galaxy clusters.
Four of eight planned all-sky scans were done before operations stopped on 26 February 2022; eRASS1 cluster counts gave S8 = 0.86 ± 0.01.
Measures
galaxy clusters, quasars, large-scale structure
Telescope
eROSITA X-ray telescope on the Spektr-RG observatory
Site
Space (Sun–Earth L2)
Light
X-ray
Sky area
20,627 deg²
Objects
≈900,000 sources in eRASS1 (German half-sky), including ≈12,000 clusters
Led by
Andrea Merloni, Peter Predehl
Institutions
Max Planck Institute for Extraterrestrial Physics, DLR, Space Research Institute (IKI)
Image: Kollmeier et al. 2017, arXiv:1711.03234, Fig. 2 (SDSS-IV fields vs SDSS-V target density)
Objects
3.0 × 10⁶
After two decades of building one great map, the Sloan Digital Sky Survey started watching. Its fifth generation returns again and again to the same quasars to see how their central black holes flicker as they feed, while taking spectra of more than a million stars across the Milky Way. With telescopes in New Mexico and Chile it covers both hemispheres, and a third programme maps the glowing gas between stars.
The fifth SDSS generation turned to all-sky, repeated spectroscopy, monitoring growing supermassive black holes and mapping stars and gas in both hemispheres.
Observing began in October 2020; DR20 (2026) brought the first southern-hemisphere BOSS spectra from Las Campanas.
Measures
quasars, redshifts
Telescope
2.5 m Sloan Foundation Telescope and 2.5 m du Pont Telescope (BOSS and APOGEE spectrographs); LVM integral-field telescopes
Site
Apache Point Observatory, New Mexico; Las Campanas Observatory, Chile
Light
optical
Objects
DR20: over 3 million spectra of 1.5 million stars and half a million galaxies and quasars
Five thousand small robots on a telescope in Arizona each hold an optical fibre and swivel into place to catch the light of one galaxy or quasar, then reposition for the next patch of sky. From those spectra DESI measures distances and builds the largest 3D map of the universe so far, aiming for more than 47 million galaxies and quasars. Its results hint that dark energy may be changing over time rather than staying constant.
The largest 3D map of the universe so far, spanning redshift 0 to about 4, built to measure dark energy, structure growth and neutrino mass.
Its 2025 BAO results, combined with CMB data, favour evolving dark energy over a cosmological constant at 3.1 sigma.
Image: Brout et al. 2022, ApJ 938, 110, Fig. 4: the Pantheon+ Hubble diagram
Objects
1,550
Reach
0.001 < z < 2.26
Type Ia supernovae, a kind of exploding star, shine with almost the same peak brightness, so how faint one looks tells how far away it is. Pantheon+ gathered 1,550 of them from 18 different surveys and reprocessed them all the same way, removing differences between telescopes. The result does two jobs: it traces how the universe's expansion has sped up, and, anchored by pulsating stars in nearby galaxies, it measures how fast the universe is expanding today.
A uniform reanalysis of Type Ia supernovae from 18 surveys, used both to measure dark energy and, with SH0ES, the local Hubble constant.
Including Cepheid host distances it gives H0 = 73.5 ± 1.1 km/s/Mpc. Year is the light-curve release.
Image: NASA, ESA, M. Davis (Hubble image of the CEERS field)
Objects
26 candidate galaxies at z ≈ 9–16 in the first epoch
Sky area
0.028 deg²
Reach
z ≈ 0.5 to beyond 10
One of Webb's first science programmes, in 2022: 77 hours on a strip of sky Hubble had studied for years, to see what the new telescope could add. The answer came quickly. In the first images, a patch about a twentieth the area of the full Moon already held 26 candidate galaxies from the first 500 million years of cosmic history.
A 77.2-hour early Webb programme covering about 100 square arcminutes of the Hubble-studied Extended Groth Strip with imaging and spectroscopy.
Its first 35.5 square arcminutes already held 26 galaxy candidates from the first 500 million years.
Image: Hoffman et al. 2024, MNRAS 527, 3788, Fig. 5: Wiener-filter velocity flow lines from Cosmicflows-4 (SDvision render, D. Pomarède)
Objects
55,877
Nearly 56,000 galaxies, each with a distance from one of eight methods, from exploding stars to the spin of galaxies, stitched into one consistent catalogue. Tully, Kourkchi and Courtois sorted them into some 38,000 groups and used careful statistics to reconcile methods that do not always agree. The result is the largest catalogue of its kind, a map of how nearby galaxies move and a value for the universe's expansion rate.
The largest compilation of galaxy distances, merging eight methods with Bayesian statistics to trace motions of nearly 56,000 galaxies.
Its distances give H0 = 74.6 ± 0.8 (statistical) km/s/Mpc, with a larger potential systematic error. Year is catalogue release.
Measures
peculiar velocities
Telescope
compilation (eight distance methods)
Light
multi
Objects
55,877 galaxies in 38,065 groups
Led by
R. Brent Tully, Ehsan Kourkchi, Hélène M. Courtois
Image: NASA, ESA, CSA, B. Robertson (UC Santa Cruz), B. Johnson (CfA), S. Tacchella (Cambridge), M. Rieke (University of Arizona), D. Eisenstein (CfA)
Objects
5,000
Sky area
0.046 deg²
Reach
to z ≈ 14
About 770 hours of Webb time spent staring at two small patches of sky already famous from Hubble's deepest views, to find and study the earliest galaxies. Deep images pick out faint red specks, and a spectrograph then confirms how far back in time each one lies. In 2024 it confirmed a galaxy seen less than 300 million years after the Big Bang, the most distant known at the time.
About 770 hours of guaranteed Webb time on GOODS-South and GOODS-North, combining deep imaging with spectroscopy of galaxies in the first billion years.
It confirmed JADES-GS-z14-0, a galaxy seen less than 300 million years after the Big Bang, the most distant known when found in 2024.
Image: NASA, ESA, CSA, I. Labbe (Swinburne), R. Bezanson (University of Pittsburgh), A. Pagan (STScI)
Objects
500
Sky area
0.013 deg²
Reach
AB ≈ 29–30, magnified by the cluster Abell 2744 (z = 0.308)
Webb pointed at Pandora's Cluster, Abell 2744, a pile-up of galaxy clusters whose gravity magnifies everything behind it. Using that natural lens, UNCOVER reached galaxies fainter than any ordinary deep field can, then returned to take spectra of about 500 of them. The aim was to catch the small, faint galaxies of the first billion years, thought to have cleared the fog of hydrogen gas that filled the young universe.
A Webb treasury programme around Pandora's Cluster, Abell 2744, using its lensing to reach galaxies fainter than any field survey.
Its NIRCam imaging was taken in November 2022, with spectroscopy in summer 2023 and repeat visits in summer 2024.
Lensing cluster at z = 0.39; lensed galaxies seen less than a billion years after the Big Bang
The first full-colour image released from the James Webb Space Telescope, in July 2022, shows a cluster of galaxies in the southern constellation Volans. Its mass bends and stretches the light of much older galaxies behind it into arcs, some seen as they were less than a billion years after the Big Bang. All of it fits in a patch of sky the size of a grain of sand held at arm's length.
The first full-colour image released from JWST: the galaxy cluster SMACS J0723.3-7327 in Volans, its gravity bending light from far older galaxies behind it.
A 12.5-hour composite covering a patch of sky about the size of a grain of sand held at arm's length.
Measures
galaxy positions, weak lensing, galaxy clusters
Telescope
James Webb Space Telescope (6.5 m), NIRCam
Site
Space (Sun–Earth L2)
Light
infrared
Objects
thousands of galaxies
Reach
Lensing cluster at z = 0.39; lensed galaxies seen less than a billion years after the Big Bang
Image: WEAVE spectra along a cut through the shock front of Stephan's Quintet, Hα and [N II] lines, from Arnaudova et al. 2024, WEAVE First Light Observations (arXiv:2411.13635), Fig. 2
Objects
planned: about 700,000 LOFAR radio sources and 400,000 quasars among several million stars and galaxies
WEAVE is a new spectrograph on the 4.2-metre William Herschel Telescope in the Canary Islands. Two robots place close to 1,000 optical fibres on stars and galaxies across a field 2 degrees wide, and each fibre carries that object's light to be split into a spectrum. Over its first five to seven years it is meant to gather millions of spectra, from Milky Way stars measured by Gaia to radio galaxies found by LOFAR and distant quasars whose light maps the gas between galaxies.
A massively multiplexed fibre spectrograph on the WHT running eight surveys, from Galactic archaeology to LOFAR radio galaxies and a quasar survey of large-scale structure at z > 2.
First light came in December 2022 with its large integral-field unit, which recorded spectra at 31,500 positions across two galaxies in Stephan's Quintet in two hours.
Image: ESA/Webb, NASA & CSA, G. Gozaliasl, A. Koekemoer, M. Franco, and the COSMOS-Web team
Objects
8.0 × 10⁵
Sky area
0.54 deg²
Reach
NIRCam 5σ ≈ 27.5–28.2 mag; reionization-era galaxies at 6 < z < 11
Webb's largest programme in its first year spent 255 hours building a single mosaic of the COSMOS field, a patch of sky nearly three times the area of the full Moon that many telescopes had already studied. Covering more ground than Webb's other deep views lets astronomers see how early galaxies gathered into groups and filaments. Its catalogue lists nearly 800,000 galaxies.
The largest Webb programme of its first year: 255 hours mapping 0.54 square degrees of the COSMOS field, the widest contiguous deep Webb mosaic.
Its first six of 152 visits were taken on 5 to 6 January 2023; the full catalogue went public in 2025.
Image: ESA/Euclid/Euclid Consortium/NASA; Gaia and Planck backgrounds ESA
Objects
2.6 × 10⁷
Sky area
14,000 deg²
Reach
about the last ten billion years of cosmic history
A European space telescope, launched in July 2023, that is photographing about a third of the sky to measure the shapes of billions of galaxies, faintly bent by the dark matter in front of them, and the distances to many of them. Together these cover roughly the last ten billion years of cosmic history. The goal is to learn how dark matter and dark energy have shaped the universe's large-scale structure.
ESA's dark-universe mission is imaging about a third of the sky to measure how dark matter and dark energy shaped cosmic structure through weak lensing and galaxy clustering.
Launched 1 July 2023 on a Falcon 9; its first quick release on 19 March 2025 covered three deep fields after about one week of observing.
Image: The full ~270 deg² EMU Pilot Survey radio image (944 MHz), from Norris et al. 2021, PASA 38, e046 (arXiv:2108.00569)
Objects
2.0 × 10⁷
Sky area
20,600 deg²
A radio telescope of 36 dishes in the Western Australian outback is charting the southern half of the radio sky. Running from May 2023 to a planned finish in 2028, it expects to find about 20 million radio sources, most of them distant galaxies powered by black holes or bursts of star formation. It is meant to be the reference atlas of the southern radio sky before the much larger Square Kilometre Array comes online.
An ASKAP survey of the southern radio sky, designed as the reference continuum atlas of the south ahead of the SKA.
Full survey operations began in May 2023 and are projected to finish in 2028, covering 2π steradians.
Measures
galaxy positions, large-scale structure
Telescope
Australian Square Kilometre Array Pathfinder (ASKAP), 943 MHz
Site
Murchison Radio-astronomy Observatory, Western Australia
Image: Simons Observatory LAT survey footprint over the dust sky, with DESI, Rubin, Euclid and DES footprints, from Simons Observatory Collaboration 2025 (arXiv:2503.00636)
Objects
forecast ≈16,000 clusters and >20,000 extragalactic sources
At about 5,200 metres in the Chilean Andes, one 6-metre telescope and three small ones study the oldest light in the universe, the afterglow of the Big Bang. They map how that light is polarised, the direction in which its waves vibrate, aiming for maps about ten times more sensitive than the Planck satellite's. Faint patterns in it could reveal gravitational waves from the universe's first instant.
The successor to ACT on the same Chilean plateau, aiming at polarization maps about ten times more sensitive than Planck's.
The small telescopes began observing in 2024; the 6 m Large-Aperture Telescope saw first light on 22 February 2025. Its planned American successor, CMB-S4, about 21 telescopes carrying roughly half a million detectors, was cancelled in July 2025 when the Department of Energy and the National Science Foundation withdrew their support, before any telescope was built.
Image: Verdier et al. 2025, arXiv:2508.07311, Fig. 4 (4MOST-CRS footprint on stellar density)
A new instrument on ESO's VISTA telescope in Chile, with 2,436 optical fibres that can each catch the light of one star or galaxy at the same time. First light came on 18 October 2025. Over the coming decade it is planned to gather millions of spectra across the southern sky, from Milky Way stars to distant galaxies and quasars whose positions trace the universe's expansion.
A new fibre spectrograph on ESO's VISTA telescope that will collect millions of spectra of southern stars and galaxies over the coming decade.
It saw first light on 18 October 2025, observing the Sculptor Galaxy and the globular cluster NGC 288.
SPHEREx is a small NASA space telescope, its mirror just 20 centimetres across, that photographs the entire sky in 102 infrared colours. Splitting light that finely gives a rough distance for hundreds of millions of galaxies, turning a flat picture into a 3D map. The pattern of galaxies on the largest scales may hold a fingerprint of inflation, the burst of expansion thought to have happened in the universe's first fraction of a second.
A NASA explorer that maps the entire sky in 102 infrared colours, building a 3D map of galaxies to test what happened during cosmic inflation.
Launched in March 2025, it finished its first all-sky map in December 2025; four full-sky passes are planned in its two-year mission.
Image: SKAO (first image from an early working version of SKA-Low, March 2025)
The Square Kilometre Array is a radio observatory being built on two continents: a planned field of about 131,000 antennas in Western Australia, and some 200 dishes in South Africa's Karoo. Construction began in December 2022, and the Australian array made its first image in March 2025 with just 1,000 antennas. Its main cosmic goal is to map hydrogen gas, the raw material of galaxies, together with radio galaxies across most of cosmic history.
The next-generation radio observatory, being built on two continents, intended to map neutral hydrogen and radio galaxies across cosmic time.
Construction began on 5 December 2022; SKA-Low made its first image in March 2025 with 1,000 antennas. Headquarters at Jodrell Bank.
Japan's Subaru Telescope on Maunakea gained a spectrograph with about 2,400 optical fibres, able to record light from violet through to the near-infrared in a single exposure. Its survey programme splits three ways: distant star-forming galaxies that map how the universe expanded, the growth of galaxies over time, and the ages and motions of stars in our own galaxy. It opened to Subaru users in early 2025.
A 2,400-fibre optical and near-infrared spectrograph on Subaru whose survey programme covers emission-line galaxies, galaxy evolution and Milky Way archaeology.
It covers 380 to 1260 nanometres in one exposure and was offered to Subaru users from early 2025.
Image: Roman Observations Time Allocation Committee 2025, Final Report and Recommendations, arXiv:2505.10574, Fig. 1
Objects
hundreds of millions of faint galaxies planned
Sky area
5,000 deg²
NASA's Nancy Grace Roman Space Telescope has a mirror the size of Hubble's but sees a far wider patch of sky at once. Its main cosmology survey will image and take spectra of about 12 per cent of the sky in under eighteen months, measuring hundreds of millions of faint galaxies to track dark matter and dark energy. Roman launched on 30 August 2026; the survey itself has not yet begun.
Roman's core cosmology survey will image and take spectra over more than 5,000 square degrees, about 12 percent of the sky, in under a year and a half.
Roman launched on a Falcon Heavy on 30 August 2026, about eight months ahead of schedule; the survey has not yet begun. A second cosmology survey, the High-Latitude Time-Domain Survey, will return to about 18 square degrees every five days for two years to find distant Type Ia supernovae, exploding stars used as distance markers.
Image: NSF–DOE Vera C. Rubin Observatory/NOIRLab/SLAC/AURA
Reach
single visit r ≈ 24.5
On a Chilean mountaintop, a telescope carrying a 3.2-gigapixel camera photographs the entire sky visible from the south every few nights, and will keep doing so for ten years. Put together, the images become a ten-year film of a changing sky, from asteroids to exploding stars, and a deep map of billions of galaxies whose shapes trace dark matter. The survey officially began on 29 June 2026.
A ten-year movie of the southern sky, imaging the whole visible sky every few nights to map dark matter, dark energy and the changing universe.
First Look images were released on 23 June 2025; the ten-year survey officially began on 29 June 2026.
Image: Planck 353 GHz vs simulated LiteBIRD 337 GHz polarized dust map, from LiteBIRD Collaboration 2023, PTEP 2023, 042F01 (arXiv:2202.02773)
Sky area
41,253 deg²
A planned Japanese-led satellite, due for launch around 2036, that will map the faint polarisation of the Big Bang's afterglow across the whole sky. It is hunting a particular twisting pattern that gravitational waves from inflation, the universe's first violent instant of expansion, would have left in that light. Finding it, or ruling it out down to very small amounts, would test the leading idea of how the universe began.
A planned JAXA-led satellite to map CMB polarization over the whole sky and test inflation through primordial gravitational waves.
Target sensitivity on the tensor-to-scalar ratio is δr < 0.001; launch is now planned for Japanese fiscal year 2036 on an H3 rocket.
Measures
CMB polarization
Telescope
Low-, Mid- and High-Frequency Telescopes (LFT, MFT, HFT), 15 bands from 34 to 448 GHz
Site
Space (Sun–Earth L2), planned
Light
microwave
Sky area
41,253 deg²
Institutions
JAXA, NASA, ESA, Canadian Space Agency, Italian Space Agency
Countries
Canada, France, Italy, Japan, Netherlands, United Kingdom, United States
An immersive, soothing voyage to abstract infinity awaits. Best with long,
slow space-ambient music — whatever lets you drift — your screen full, and
nothing asked of you for a while.