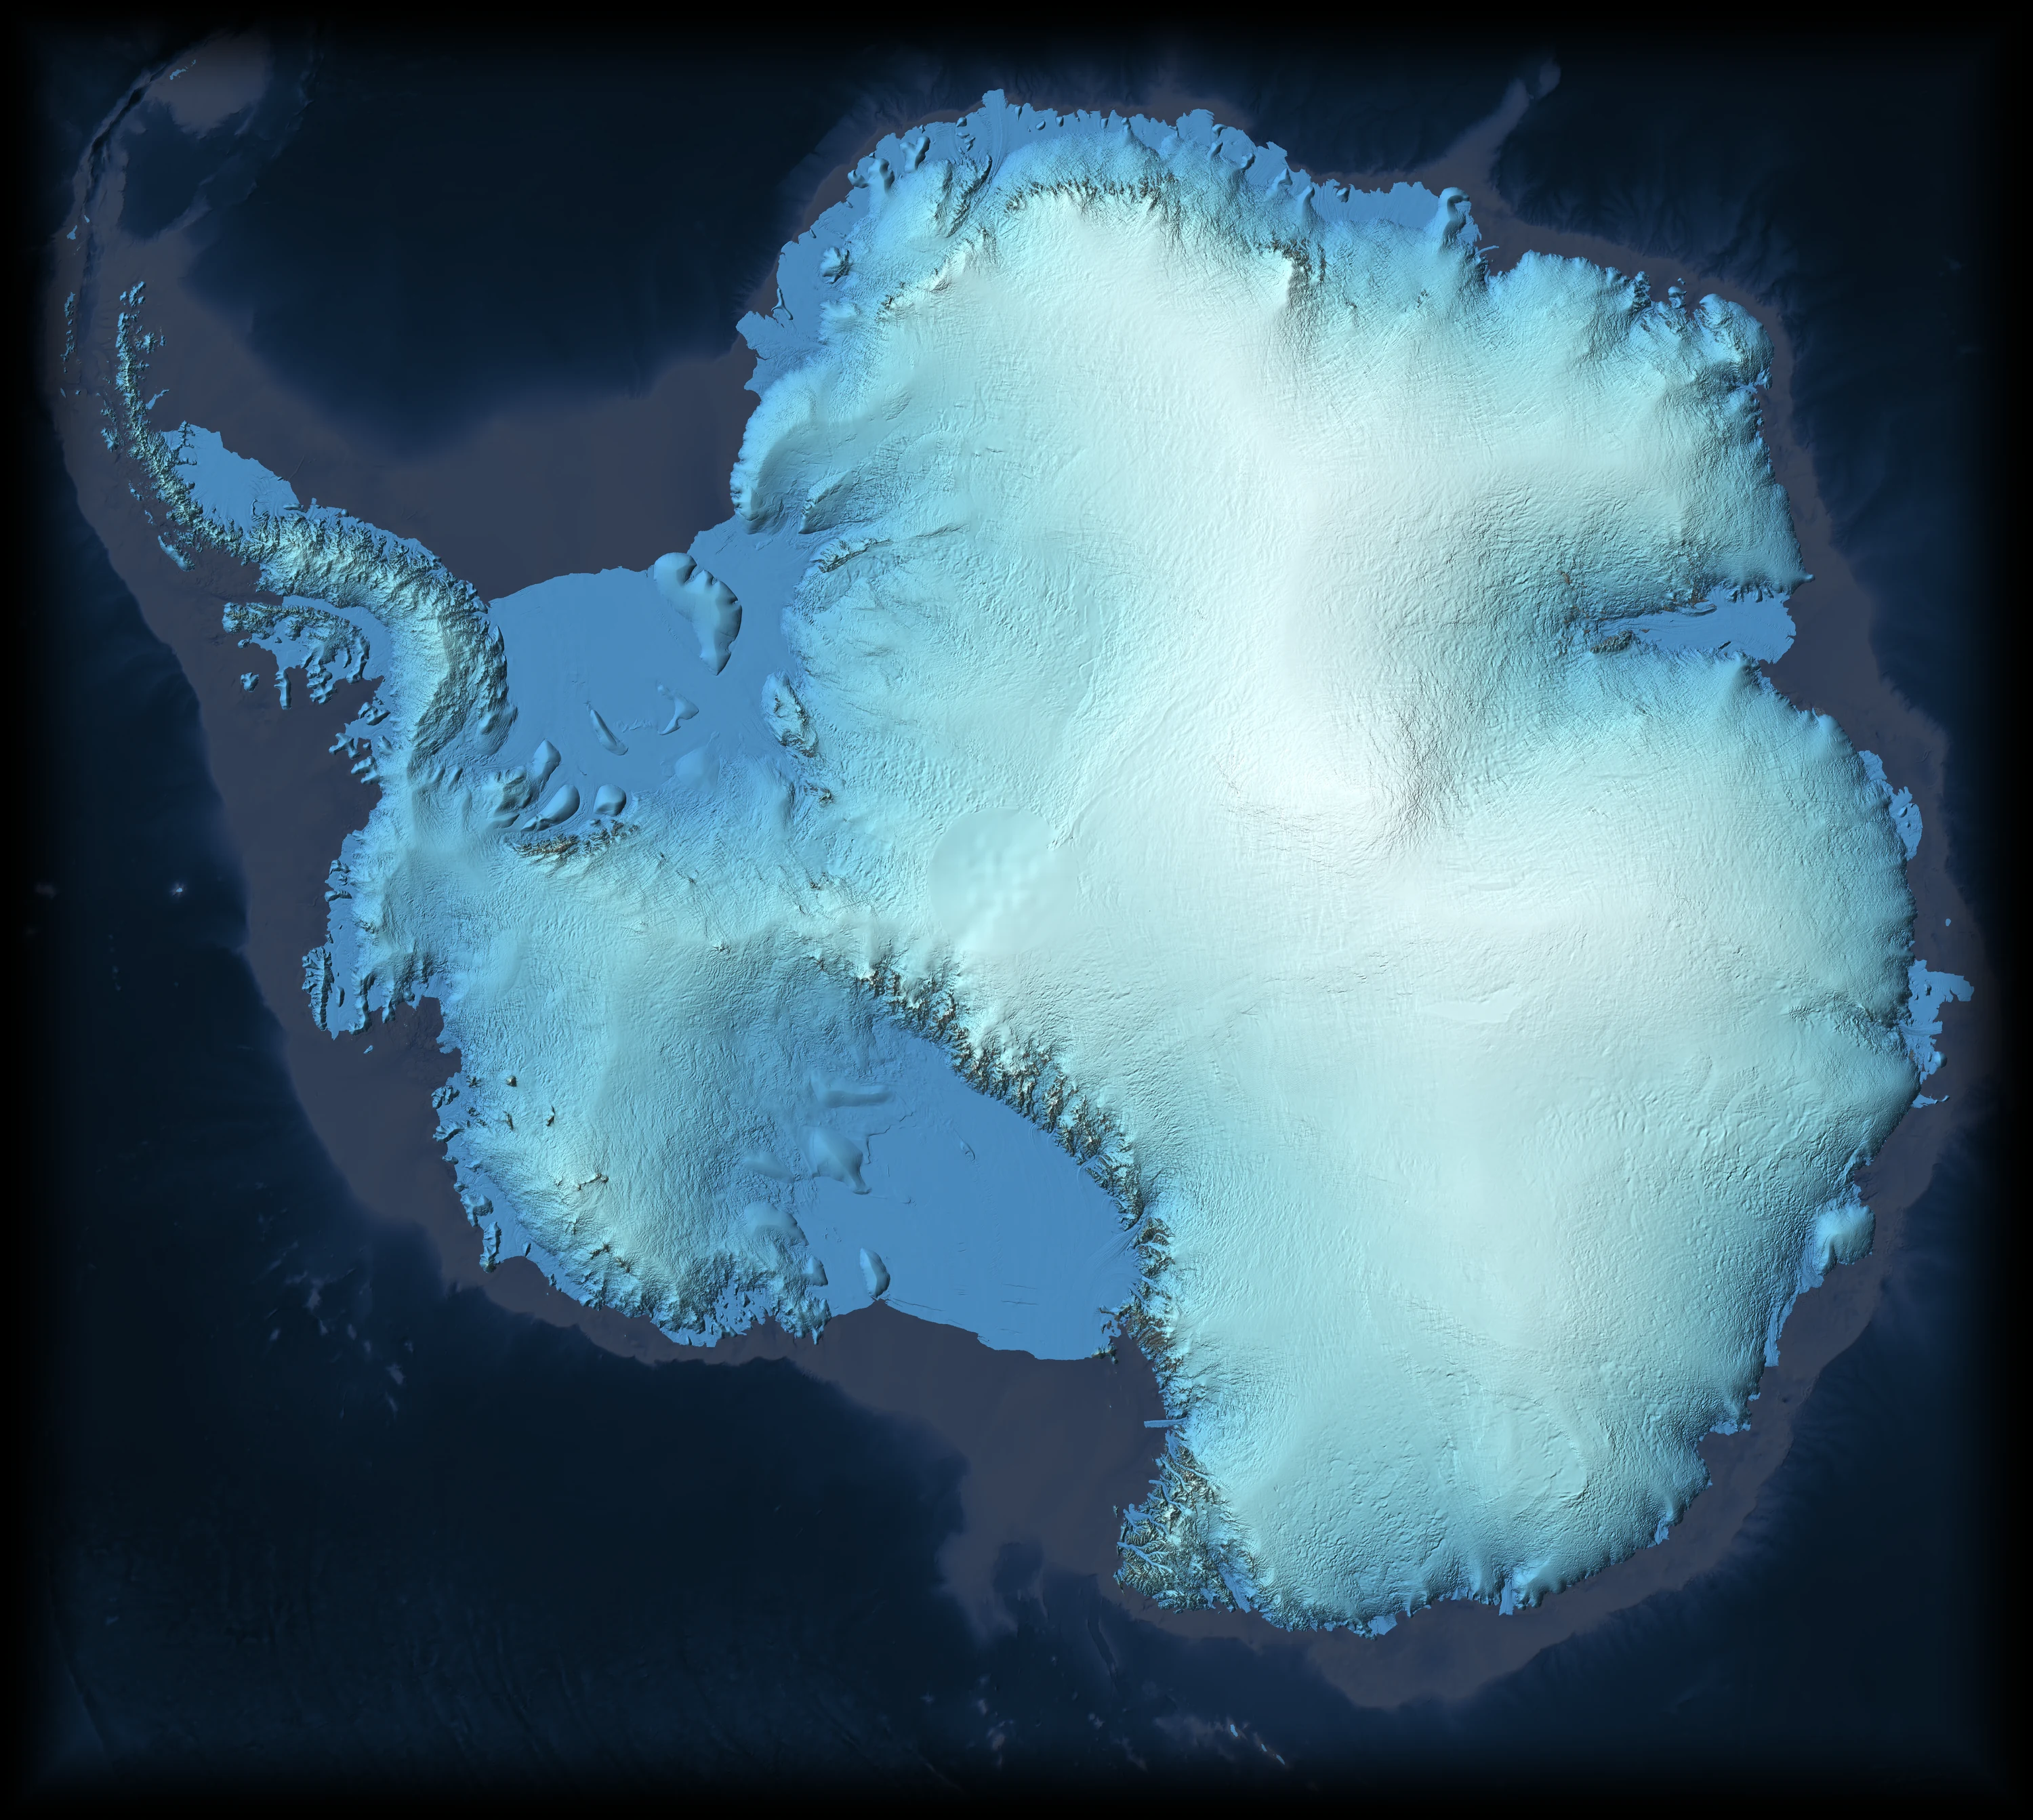
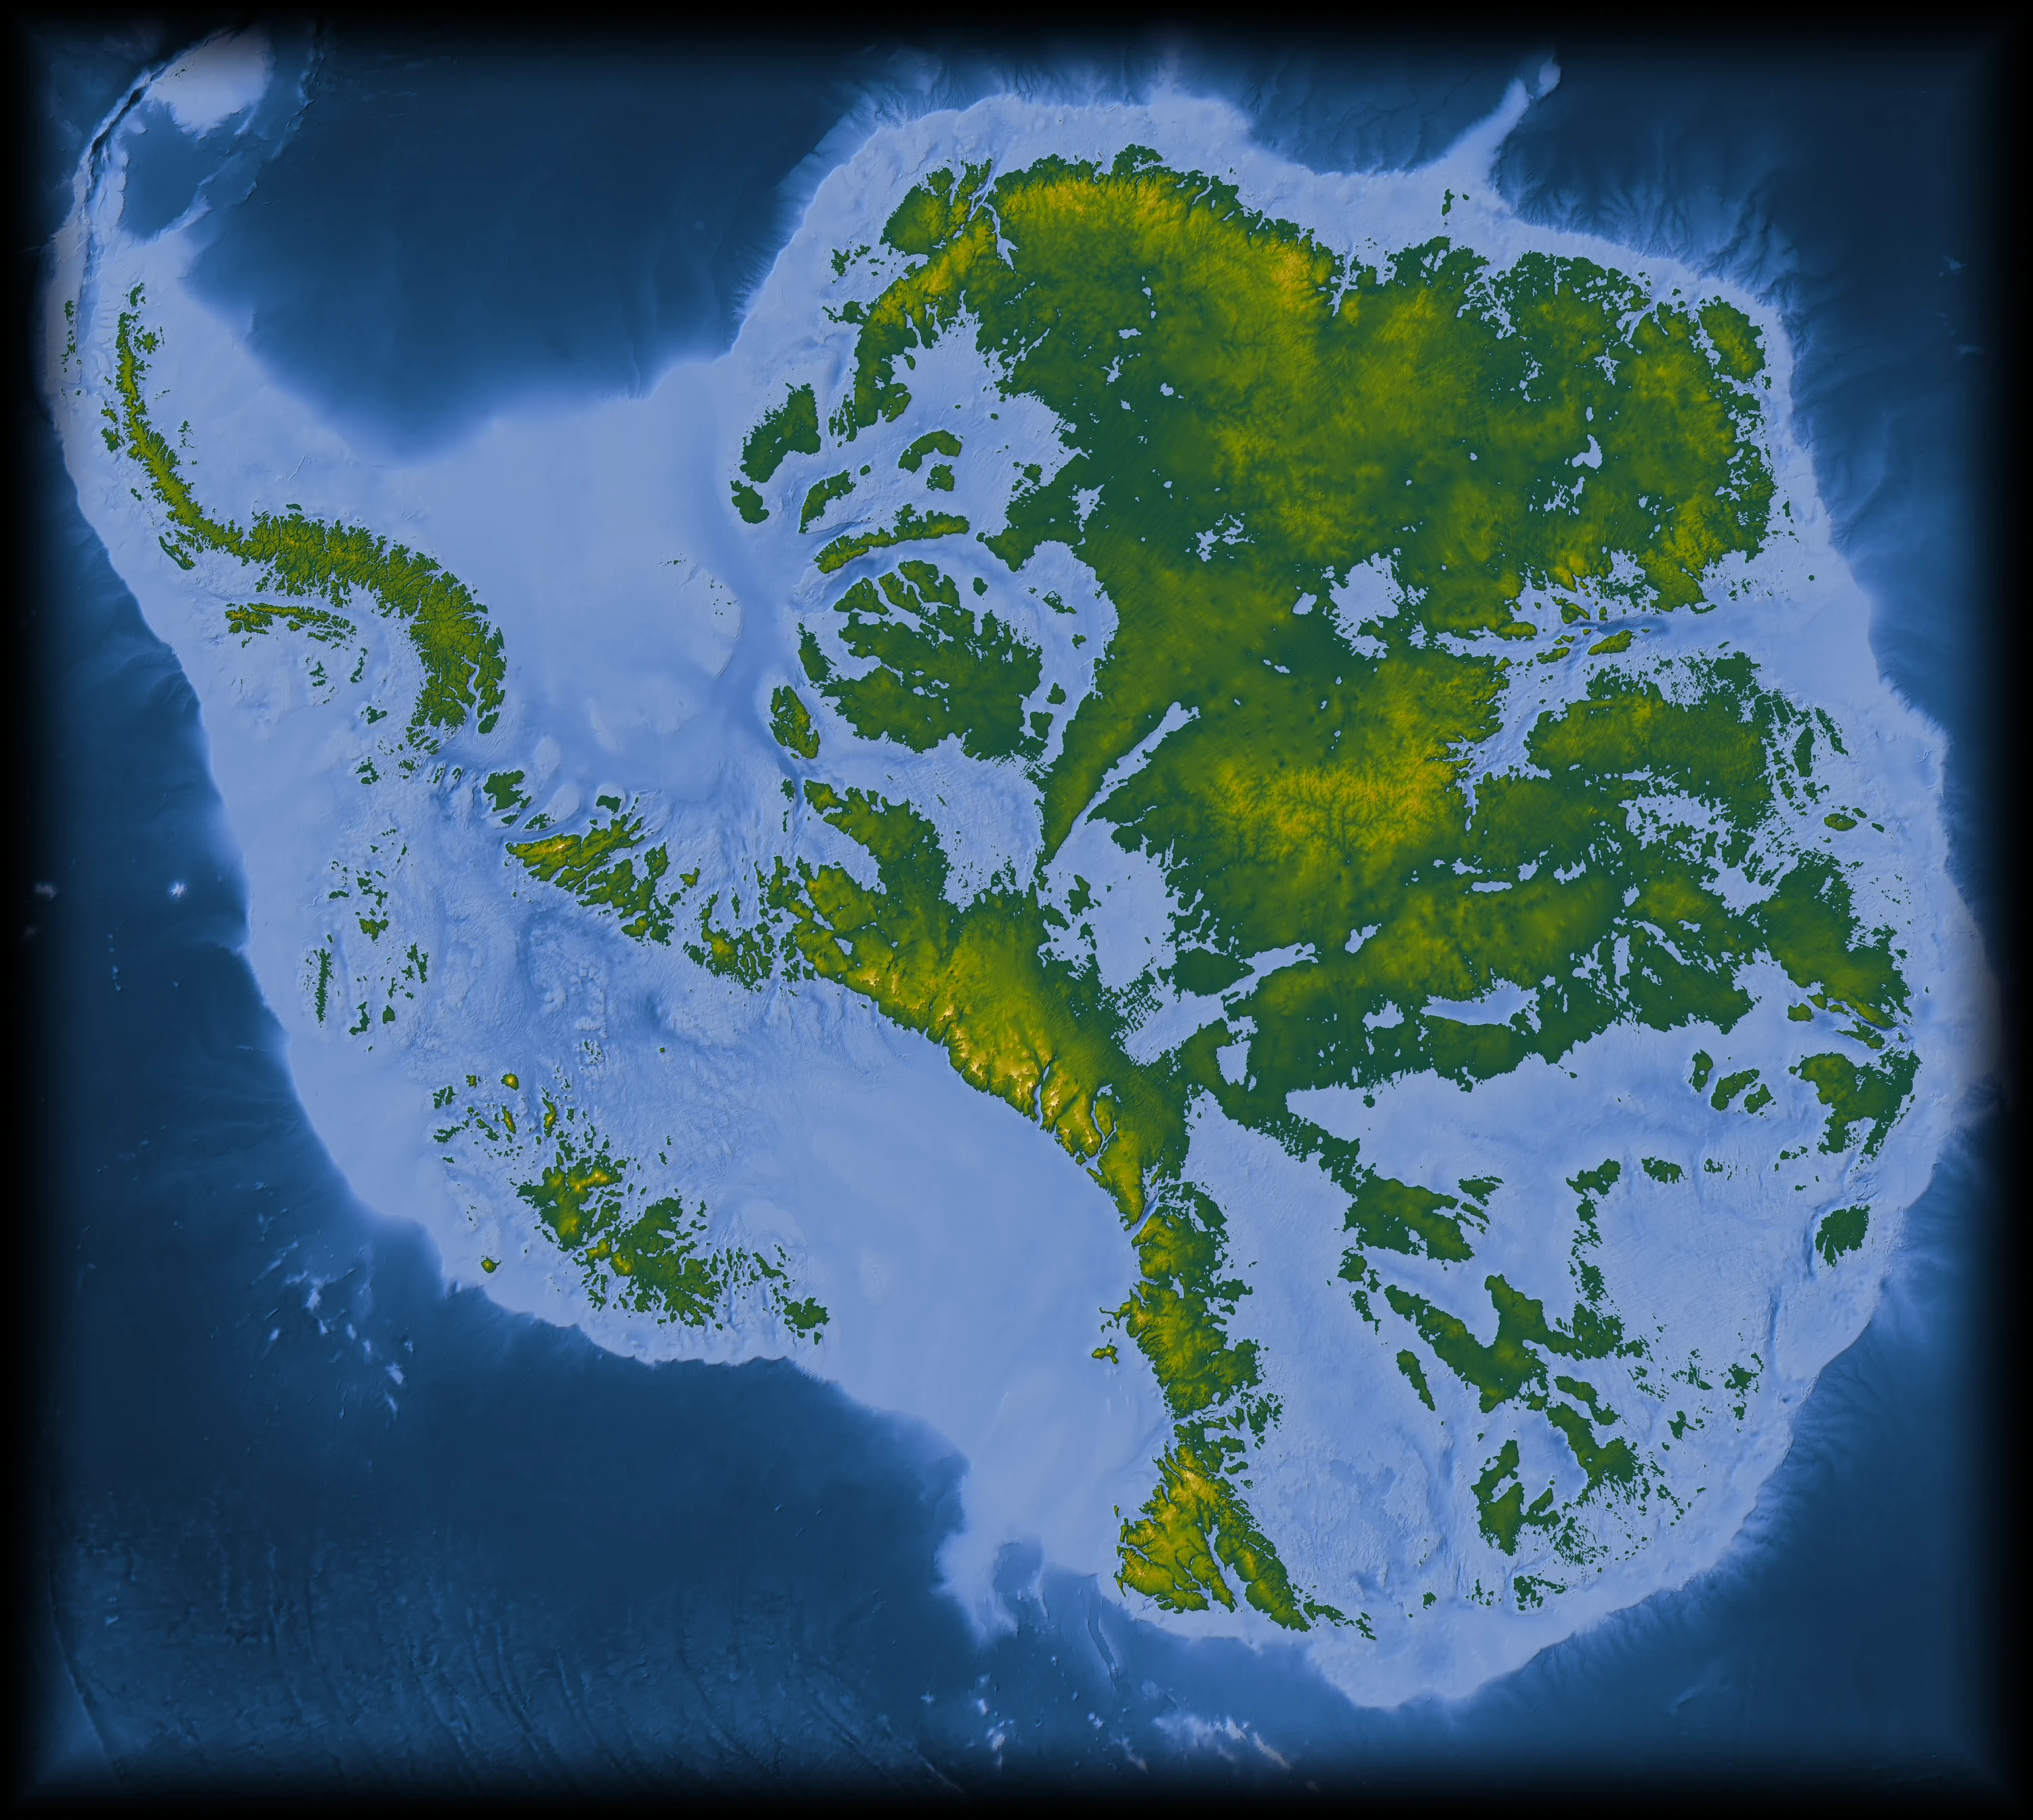
- Surface
- ·
- Ice
- ·
- Bedrock
- ·
Antarctica
The continent under the ice
Almost all of Antarctica is hidden. A sheet of ice up to five kilometres thick sits on mountain ranges the size of the Alps, canyons deeper than any on open land, lakes that have not seen daylight for millions of years and volcanoes no one has watched erupt.
Move the lens across the ice to see the rock beneath it.
The bedrock was mapped by radar from aircraft over seven decades, then filled between the flight lines with satellite measurements of how the ice flows over its bed.
Sources
- Morlighem, M. et al. 2020. Deep glacial troughs and stabilizing ridges unveiled beneath the margins of the Antarctic ice sheet. Nature Geoscience 13, 132–137. Data: MEaSUREs BedMachine Antarctica v4.1, NSIDC-0756. doi:10.1038/s41561-019-0510-8
- Ockenden, H., Bingham, R.G., Goldberg, D., Curtis, A. and Morlighem, M. 2026. Complex mesoscale landscapes beneath Antarctica mapped from space. Science 391, 314–319. doi:10.1126/science.ady2532
How we know
Three maps of the same floor
No one has seen this rock. Every map of it is an argument from evidence, and the three here argue differently.
BedMachine, the map shown here, uses radar where aircraft flew and, between the flight lines, the physics of ice flowing over hills and hollows that bend its surface.
Bedmap3 keeps to radar alone. Its 82 million measurements are joined by interpolation, and the beads you see are the survey tracks showing through.
DeepBedMap asked a neural network to invent the fine texture. It looks sharp, but its detail is predicted, not measured.
Drag the seam. Then zoom into the Gamburtsev Mountains, near the middle of East Antarctica, where the three disagree most.
Sources
- Moholdt, G., Pritchard, H. and Maton, J. 2025. RINGS/Bedmap3 grounding line of the Antarctic Ice Sheet. Norwegian Polar Institute. CC0 1.0. doi:10.21334/npolar.2025.d1062d2a
- Morlighem, M. et al. 2020. Deep glacial troughs and stabilizing ridges unveiled beneath the margins of the Antarctic ice sheet. Nature Geoscience 13, 132–137. Data: MEaSUREs BedMachine Antarctica v4.1, NSIDC-0756. doi:10.1038/s41561-019-0510-8
- Ockenden, H., Bingham, R.G., Goldberg, D., Curtis, A. and Morlighem, M. 2026. Complex mesoscale landscapes beneath Antarctica mapped from space. Science 391, 314–319. doi:10.1126/science.ady2532
- Pritchard, H.D. et al. 2025. Bedmap3 updated ice bed, surface and thickness gridded datasets for Antarctica. Scientific Data 12, 414. CC BY 4.0. doi:10.1038/s41597-025-04672-y
- Leong, W.J. and Horgan, H.J. 2020. DeepBedMap: a deep neural network for resolving the bed topography of Antarctica. The Cryosphere 14, 3687–3705. Tile seams feathered by GLOBAÏA. doi:10.5194/tc-14-3687-2020
Flow
Rivers made of ice
The ice is not still. It spreads from the domes under its own weight and drains to the sea through fast streams, some moving more than four kilometres a year, while the interior creeps a few metres.
Each line follows the flow, and the lines never cross. The marks gliding along them are slowed and squeezed onto a logarithmic scale, so the creeping interior still moves beside outlets a thousand times faster.
High lets a couple of hundred thousand particles drift on the measured flow, still on the same logarithmic clock. It colours by speed only.
One colour per drainage basin: all the ice inside a basin leaves the continent through its own coast.
The thin line is where the ice lifts off the bed and starts to float: the grounding line. Seaward of it lie the ice shelves.
Sources
- Rignot, E., Mouginot, J. and Scheuchl, B. 2017. MEaSUREs InSAR-Based Antarctica Ice Velocity Map, Version 2. NASA NSIDC DAAC. doi:10.5067/D7GK8F5J8M8R
- Rignot, E., Mouginot, J. and Scheuchl, B. 2011. Ice flow of the Antarctic ice sheet. Science 333, 1427–1430. doi:10.1126/science.1208336
- Jobard, B. and Lefer, W. 1997. Creating evenly-spaced streamlines of arbitrary density. Visualization in Scientific Computing '97, Springer, 43–55. The method behind the lines. doi:10.1007/978-3-7091-6876-9_5
- Mouginot, J., Scheuchl, B. and Rignot, E. 2017. MEaSUREs Antarctic Boundaries for IPY 2007–2009 from Satellite Radar, Version 2. NASA NSIDC DAAC. doi:10.5067/AXE4121732AD
- Morlighem, M. et al. 2020. Deep glacial troughs and stabilizing ridges unveiled beneath the margins of the Antarctic ice sheet. Nature Geoscience 13, 132–137. Data: MEaSUREs BedMachine Antarctica v4.1, NSIDC-0756. doi:10.1038/s41561-019-0510-8
Water in the dark
Lakes and streams under the ice
Where the bed is warm enough, from the Earth's own heat and the friction of sliding ice, it melts. The water gathers in hollows as lakes and runs downhill under the ice, steered by the slope of the surface above as much as by the rock below.
Nearly seven hundred dots mark lakes, most of them found by radar. Filled shapes are lakes that drain and refill, seen from space as the ice above them sinks and rises. The ones rimmed in white, 85 of them, were first found in 2025.
Point at a lake to read it.
The branching network is modelled, not observed: it shows where meltwater should flow, given the bed and the ice.
Sources
- Wright, A. and Siegert, M. 2012. A fourth inventory of Antarctic subglacial lakes. Antarctic Science 24, 659–664. doi:10.1017/S095410201200048X
- Livingstone, S.J. et al. 2022. Subglacial lakes and their changing role in a warming climate. Nature Reviews Earth & Environment 3, 106–124. Inventory data CC BY 4.0, University of Sheffield. doi:10.1038/s43017-021-00246-9
- Livingstone, S.J. et al. 2022. Global inventory of subglacial lakes (dataset). University of Sheffield. CC BY 4.0. doi:10.15131/shef.data.18094037.v1
- Smith, B.E., Fricker, H.A., Joughin, I.R. and Tulaczyk, S. 2009. An inventory of active subglacial lakes in Antarctica detected by ICESat (2003–2008). Journal of Glaciology 55, 573–595. doi:10.3189/002214309789470879
- Siegfried, M.R. and Fricker, H.A. 2018. Thirteen years of subglacial lake activity in Antarctica from multi-mission satellite altimetry. Annals of Glaciology 59(76pt1), 42–55. Outlines from Siegfried2021-GRL v1.0 (Zenodo 4914107), Copyright (c) 2021 Matthew R. Siegfried, BSD 3-Clause License, provided as is without warranty. doi:10.1017/aog.2017.36
- Wilson, S.F., Hogg, A.E. et al. 2025. Detection of 85 new active subglacial lakes in Antarctica from a decade of CryoSat-2 data. Nature Communications 16, 8311. doi:10.1038/s41467-025-63773-9
- Wilson et al. 2025, active subglacial lake outlines and time series (dataset). Zenodo. CC BY 4.0. doi:10.5281/zenodo.16330564
- Studinger, M. et al. 2003. Ice cover, landscape setting, and geological framework of Lake Vostok, East Antarctica. Earth and Planetary Science Letters 205, 195–210. doi:10.1016/S0012-821X(02)01041-5
- Bell, R.E., Studinger, M., Shuman, C.A., Fahnestock, M.A. and Joughin, I. 2007. Large subglacial lakes in East Antarctica at the onset of fast-flowing ice streams. Nature 445, 904–907. doi:10.1038/nature05554
- Le Brocq, A.M. et al. 2013. Evidence from ice shelves for channelized meltwater flow beneath the Antarctic Ice Sheet. Nature Geoscience 6, 945–948. Modelled water flux. doi:10.1038/ngeo1977
- Matsuoka, K. et al. 2021. Quantarctica, an integrated mapping environment for Antarctica, the Southern Ocean, and sub-Antarctic islands. Environmental Modelling & Software 140, 105015. Several layers were gathered through it. doi:10.1016/j.envsoft.2021.105015
Meteorites
Stones from space on blue ice
More than 60% of all the meteorites ever found on Earth come from Antarctica. Snow buries them, the ice carries them for thousands of years, and where the flow runs into a mountain it slows, rises and is worn away by dry wind. The stones are left lying on bare blue ice, dark on pale.
Dots are finds with a known position, coloured by kind. Among them are pieces of the Moon and of Mars. The cyan marks are the 613 places where, by a 2022 machine-learning study, the ice should be laying meteorites out. It estimated that 340,000 to 900,000 lie on the surface, so only 5 to 13% have been picked up.
- Ordinary chondrites
- Carbonaceous chondrites
- Achondrites
- Iron
- Stony-iron
- Other chondrites
- From the Moon
- From Mars
- Stranding zone
A dark stone warms in sunshine even far below zero, melts a small pocket under itself and sinks out of sight. About 5,000 a year are lost this way now, five times as many as are found.
By 2050 about 24% of the meteorites still on the ice will be lost, whatever we emit. Zones fade with the share of their area that is still cold enough; grey ones are gone.
On a high-emissions path, 76% are lost by 2100 and only 150 zones remain. Holding warming to 1.5 to 2 °C would limit the loss to 9 to 20%.
Only finds with their own coordinates are shown: most come from American, Chinese and Italian searches. Japan's great collection is barely located, so its fields look emptier than they are.
Sources
- Tollenaar, V., Zekollari, H., Lhermitte, S., Tax, D.M.J., Debaille, V., Goderis, S., Claeys, P. and Pattyn, F. 2022. Unexplored Antarctic meteorite collection sites revealed through machine learning. Science Advances 8, eabj8138. doi:10.1126/sciadv.abj8138
- Tollenaar, V. et al. 2021. Datasets for 'Unexplored Antarctic meteorite collection sites revealed through machine learning'. Zenodo. CC BY 4.0. Find positions from the Meteoritical Bulletin Database. doi:10.5281/zenodo.5749753
- Tollenaar, V., Zekollari, H., Kittel, C., Farinotti, D., Lhermitte, S., Debaille, V., Goderis, S., Claeys, P., Joy, K.H. and Pattyn, F. 2024. Antarctic meteorites threatened by climate warming. Nature Climate Change 14, 340–343. doi:10.1038/s41558-024-01954-y
- Tollenaar, V. et al. 2024. Datasets for 'Antarctic meteorites threatened by climate warming' (stranding zones in 2050 and 2100). Zenodo. CC BY-SA 4.0. doi:10.5281/zenodo.10579625
Icebergs
Fifty years of drift
When a shelf breaks, the pieces go to sea. Satellites have followed the big ones since 1976: anticlockwise round the continent on the coastal current, then north out of the Weddell Sea into the open ocean.
Where many icebergs took the same path, the lines add up and glow.
Brightness counts the days icebergs spent in each patch of ocean over the whole record, on a logarithmic scale.
The map has pulled back past the coast: the faint circles mark 70, 60, 50 and 40 degrees south. The record runs to April 2026: it includes A68, which broke from the Larsen C shelf in 2017, and A23a, which came loose in 2020 after more than thirty years aground and drifted north out of the Weddell Sea.
Sources
- Data: Brigham Young University (BYU), Antarctic Iceberg Tracking Database, v8.0. Budge, J.S. and Long, D.G. 2018. A Comprehensive Database for Antarctic Iceberg Tracking Using Scatterometer Data. IEEE JSTARS 11, 434–442. Positions from the Consolidated Antarctic Iceberg Database v8.0 (1976 to April 2026); sizes from the Antarctic Iceberg Statistical Database v7.1 (to August 2023), BYU and the US National Ice Center. doi:10.1109/JSTARS.2017.2784186
Life on the edge
Penguins on the coast
Almost all life in Antarctica clings to the edge, where the sea feeds it. Each dot is a penguin colony that has been counted, from the ground, from the air or from space; bigger dots, bigger colonies.
- Emperor
- Adélie
- Chinstrap
- Gentoo
- Macaroni
- King
Emperors breed on sea ice fastened to the coast, and their chicks need it to last until they grow waterproof feathers. Satellites found 66 emperor colonies in 2023. In 2022, record-low sea ice broke up under four of the five colonies in the Bellingshausen Sea before the chicks could fledge, the first widespread failure clearly tied to shrinking sea ice.
Ringed in red: the Bellingshausen colonies of 2022. Counts differ in kind (nests, adults or chicks) and year; point at a colony to read its own.
Sources
- Che-Castaldo, C., Humphries, G. and Lynch, H. 2023. Antarctic Penguin Biogeography Project: database of abundance and distribution for the Adélie, chinstrap, gentoo, emperor, macaroni and king penguin south of 60 S. Biodiversity Data Journal 11, e101476. Data CC BY 4.0. doi:10.3897/BDJ.11.e101476
- Mapping Application for Penguin Populations and Projected Dynamics (MAPPPD) database, SCAR-AntOBIS. CC BY 4.0. doi:10.48361/zftxkr
- Fretwell, P. 2024. Emperor penguin colony locations derived from satellite remote sensing across Antarctica, 2023. NERC EDS UK Polar Data Centre. Contains public sector information licensed under the Open Government Licence v3.0. doi:10.5285/fb0547e4-d2c1-4580-8c98-182f1da7d9ae
- Fretwell, P.T. et al. 2012. An emperor penguin population estimate: the first global, synoptic survey of a species from space. PLoS ONE 7, e33751. doi:10.1371/journal.pone.0033751
- Fretwell, P.T., Boutet, A. and Ratcliffe, N. 2023. Record low 2022 Antarctic sea ice led to catastrophic breeding failure of emperor penguins. Communications Earth & Environment 4, 273. doi:10.1038/s43247-023-00927-x
Tipping points
Where the ice could pass a threshold
Each drainage basin has a range of global warming beyond which its ice would keep retreating even if the warming stopped. Red basins cross that line first, below 1 °C above pre-industrial; green ones hold out past 7 °C.
The world is already about 1.3 °C warmer. The first basins to go sit in West Antarctica, where the bed lies far below sea level and slopes down inland.
- ≤ 1 °C
- ≤ 2 °C
- ≤ 3 °C
- ≤ 4 °C
- ≤ 5 °C
- ≤ 6 °C
- 7 °C and more
Click a basin. Thresholds and commitments as published in 2026 by Winkelmann, Garbe, Donges and Albrecht. Five stories follow.
Sources
- Smith, B., Jelley, B.P., Dickinson, S., Sutterley, T., Neumann, T. and Harbeck, K. 2026. ATLAS/ICESat-2 L3B Gridded Antarctic and Greenland Height Change (ATL15), version 6. NASA National Snow and Ice Data Center DAAC. Seven-year rate, April 2019 to April 2026. doi:10.5067/ATLAS/ATL15.006
- Winkelmann, R., Garbe, J., Donges, J.F. and Albrecht, T. 2026. Mapping tipping risks from Antarctic ice basins under global warming. Nature Climate Change 16, 341–349. doi:10.1038/s41558-025-02554-0
- Mouginot, J., Scheuchl, B. and Rignot, E. 2017. MEaSUREs Antarctic Boundaries for IPY 2007–2009 from Satellite Radar, Version 2. NASA NSIDC DAAC. doi:10.5067/AXE4121732AD
- The IMBIE team 2018. Mass balance of the Antarctic Ice Sheet from 1992 to 2017. Nature 558, 219–222. doi:10.1038/s41586-018-0179-y
- Morlighem, M. et al. 2020. Deep glacial troughs and stabilizing ridges unveiled beneath the margins of the Antarctic ice sheet. Nature Geoscience 13, 132–137. Data: MEaSUREs BedMachine Antarctica v4.1, NSIDC-0756. doi:10.1038/s41561-019-0510-8
Tipping points · 1 of 5
The glaciers already moving
Of all eighteen basins, this one tips first, somewhere between 0 and 1 °C of warming. Past that line about 70% of its ice is committed to the sea over the long run: 0.9 m of sea level from a basin that holds 1.3 m.
The bedrock here deepens inland. As the line where the ice lifts off its bed moves back, it meets thicker ice that flows out faster, and the retreat feeds itself. Between 1992 and 2011 that line moved back 31 km at Pine Island and 14 km at Thwaites.
Off the Thwaites front, ridges on the seabed, one pressed into the mud by each tide, show that the glacier once pulled back more than 2.1 km a year: twice the fastest pace seen from space.
Whether the runaway has already begun is still argued. Committed here means over centuries, not within this century.
Warm seawater is already at work underneath. Thwaites loses about 27 m of ice a year from its underside and Pine Island about 14 m, the fastest of the big shelves. Red on the map is melting, blue is seawater freezing back on.
Sources
- Adusumilli, S., Fricker, H.A., Medley, B., Padman, L. and Siegfried, M.R. 2020. Interannual variations in meltwater input to the Southern Ocean from Antarctic ice shelves. Nature Geoscience 13, 616–620. doi:10.1038/s41561-020-0616-z
- Adusumilli et al. 2020, Antarctic ice-shelf basal melt rates, 2010–2018, 500 m (dataset). UC San Diego Library. CC BY 4.0. doi:10.6075/J04Q7SHT
- Winkelmann, R., Garbe, J., Donges, J.F. and Albrecht, T. 2026. Mapping tipping risks from Antarctic ice basins under global warming. Nature Climate Change 16, 341–349. doi:10.1038/s41558-025-02554-0
- Rignot, E., Mouginot, J., Morlighem, M., Seroussi, H. and Scheuchl, B. 2014. Widespread, rapid grounding line retreat of Pine Island, Thwaites, Smith, and Kohler glaciers, West Antarctica, from 1992 to 2011. Geophysical Research Letters 41, 3502–3509. doi:10.1002/2014GL060140
- Graham, A.G.C. et al. 2022. Rapid retreat of Thwaites Glacier in the pre-satellite era. Nature Geoscience 15, 706–713. doi:10.1038/s41561-022-01019-9
- Hill, E.A. et al. 2023. The stability of present-day Antarctic grounding lines, Part 1: No indication of marine ice sheet instability in the current geometry. The Cryosphere 17, 3739–3759. doi:10.5194/tc-17-3739-2023
- Reese, R. et al. 2023. The stability of present-day Antarctic grounding lines, Part 2: Onset of irreversible retreat of Amundsen Sea glaciers under current climate on centennial timescales cannot be excluded. The Cryosphere 17, 3761–3783. doi:10.5194/tc-17-3761-2023
- Morlighem, M. et al. 2020. Deep glacial troughs and stabilizing ridges unveiled beneath the margins of the Antarctic ice sheet. Nature Geoscience 13, 132–137. Data: MEaSUREs BedMachine Antarctica v4.1, NSIDC-0756. doi:10.1038/s41561-019-0510-8
- Mouginot, J., Scheuchl, B. and Rignot, E. 2017. MEaSUREs Antarctic Boundaries for IPY 2007–2009 from Satellite Radar, Version 2. NASA NSIDC DAAC. doi:10.5067/AXE4121732AD
- The IMBIE team 2018. Mass balance of the Antarctic Ice Sheet from 1992 to 2017. Nature 558, 219–222. doi:10.1038/s41586-018-0179-y
- Secretariat SCAR (1992, updated 2025). Composite Gazetteer of Antarctica, Scientific Committee on Antarctic Research. Place names on the map. Maintained by the Italian National Antarctic Research Program, hosted by the Australian Antarctic Data Centre. http://placenames.aq/
Tipping points · 2 of 5
The Byrd basin, behind the door
Behind Thwaites and the Siple Coast lies the Byrd Subglacial Basin, the deep heart of West Antarctica. In the Bentley Subglacial Trench the rock lies 2,587 m below sea level, and 85% of the ice in this view rests on a bed below the sea.
In 1978 the glaciologist John Mercer warned that warming could start a rapid collapse of West Antarctica, a threat of disaster. Models since then find that once the Amundsen coast gives way, nothing in the shape of the bed stops the retreat from running through these interior basins: at least 3 m of sea level over centuries to millennia.
Under the ice of Marie Byrd Land, the shape of the bed shows 138 volcanic cones, and earthquake swarms beneath the Executive Committee Range point to magma moving today. Whether their heat speeds the loss of ice is not established.
Drop the sea level in the relief lab at the bottom of the page to see this basin flood.
Sources
- Morlighem, M. et al. 2020. Deep glacial troughs and stabilizing ridges unveiled beneath the margins of the Antarctic ice sheet. Nature Geoscience 13, 132–137. Data: MEaSUREs BedMachine Antarctica v4.1, NSIDC-0756. doi:10.1038/s41561-019-0510-8
- Mercer, J.H. 1978. West Antarctic ice sheet and CO2 greenhouse effect: a threat of disaster. Nature 271, 321–325. doi:10.1038/271321a0
- Feldmann, J. and Levermann, A. 2015. Collapse of the West Antarctic Ice Sheet after local destabilization of the Amundsen Basin. PNAS 112, 14191–14196. doi:10.1073/pnas.1512482112
- Winkelmann, R., Garbe, J., Donges, J.F. and Albrecht, T. 2026. Mapping tipping risks from Antarctic ice basins under global warming. Nature Climate Change 16, 341–349. doi:10.1038/s41558-025-02554-0
- van Wyk de Vries, M., Bingham, R.G. and Hein, A.S. 2018. A new volcanic province: an inventory of subglacial volcanoes in West Antarctica. Geological Society, London, Special Publications 461, 231–248. doi:10.1144/SP461.7
- Lough, A.C. et al. 2013. Seismic detection of an active subglacial magmatic complex in Marie Byrd Land, Antarctica. Nature Geoscience 6, 1031–1035. doi:10.1038/ngeo1992
- Secretariat SCAR (1992, updated 2025). Composite Gazetteer of Antarctica, Scientific Committee on Antarctic Research. Place names on the map. Maintained by the Italian National Antarctic Research Program, hosted by the Australian Antarctic Data Centre. http://placenames.aq/
Tipping points · 3 of 5
East Antarctica's soft underbelly
East Antarctica is not as safe as its size suggests. The Wilkes Subglacial Basin, behind the Cook, Ninnis and Mertz glaciers, crosses its threshold at 2 to 3 °C, committing about 1.2 m of sea level. Every emissions path but the lowest reaches that warming by 2100.
Further west, the Totten and Moscow University basin holds out until 6 to 7 °C, but then commits about 5 m, the largest single loss in the study. Radar found a trough under Totten that lets warm ocean water into its cavity, where it melts the ice from below.
Beside it, Denman Glacier runs down the deepest canyon on land, its bed 4,065 m below sea level. Its grounding line slid back 5.4 km between 1996 and 2018.
Sources
- Winkelmann, R., Garbe, J., Donges, J.F. and Albrecht, T. 2026. Mapping tipping risks from Antarctic ice basins under global warming. Nature Climate Change 16, 341–349. doi:10.1038/s41558-025-02554-0
- Greenbaum, J.S. et al. 2015. Ocean access to a cavity beneath Totten Glacier in East Antarctica. Nature Geoscience 8, 294–298. doi:10.1038/ngeo2388
- Brancato, V. et al. 2020. Grounding line retreat of Denman Glacier, East Antarctica, measured with COSMO-SkyMed radar interferometry data. Geophysical Research Letters 47, e2019GL086291. doi:10.1029/2019GL086291
- Morlighem, M. et al. 2020. Deep glacial troughs and stabilizing ridges unveiled beneath the margins of the Antarctic ice sheet. Nature Geoscience 13, 132–137. Data: MEaSUREs BedMachine Antarctica v4.1, NSIDC-0756. doi:10.1038/s41561-019-0510-8
- Mouginot, J., Scheuchl, B. and Rignot, E. 2017. MEaSUREs Antarctic Boundaries for IPY 2007–2009 from Satellite Radar, Version 2. NASA NSIDC DAAC. doi:10.5067/AXE4121732AD
- The IMBIE team 2018. Mass balance of the Antarctic Ice Sheet from 1992 to 2017. Nature 558, 219–222. doi:10.1038/s41586-018-0179-y
- Secretariat SCAR (1992, updated 2025). Composite Gazetteer of Antarctica, Scientific Committee on Antarctic Research. Place names on the map. Maintained by the Italian National Antarctic Research Program, hosted by the Australian Antarctic Data Centre. http://placenames.aq/
Tipping points · 4 of 5
The giants and their doorstops
Two ice shelves the size of countries, Ross at about 500,800 km² and Filchner–Ronne at about 443,100 km², hold back the ice that drains into them like doorstops. The Filchner basin holds 11.8 m of sea level, the most of any basin; Ross East 9.6 m.
Their thresholds are high, 6 to 7 °C, but the losses are large: about 4 m committed from Filchner and 2.9 m from Ross East. Under the Filchner shelf the danger is the ocean. In one model, warm coastal water reaches the cavity this century and melting rises from 0.2 m to almost 4 m of ice a year, and the cavity then stays warm even if the climate cools back.
Other models find that the retreat here could still reverse in the present climate. The ocean may tip before the ice does.
For now their cavities stay cold. Ross melts only about 0.4 m a year on average, yet over its 358,000 km² that is still some 104 billion tonnes of meltwater. The small Amundsen Sea shelves, a fourteenth of the area, release twice as much as Ross and Filchner–Ronne together.
Sources
- Adusumilli, S., Fricker, H.A., Medley, B., Padman, L. and Siegfried, M.R. 2020. Interannual variations in meltwater input to the Southern Ocean from Antarctic ice shelves. Nature Geoscience 13, 616–620. doi:10.1038/s41561-020-0616-z
- Adusumilli et al. 2020, Antarctic ice-shelf basal melt rates, 2010–2018, 500 m (dataset). UC San Diego Library. CC BY 4.0. doi:10.6075/J04Q7SHT
- Rignot, E., Jacobs, S., Mouginot, J. and Scheuchl, B. 2013. Ice-shelf melting around Antarctica. Science 341, 266–270. doi:10.1126/science.1235798
- Winkelmann, R., Garbe, J., Donges, J.F. and Albrecht, T. 2026. Mapping tipping risks from Antarctic ice basins under global warming. Nature Climate Change 16, 341–349. doi:10.1038/s41558-025-02554-0
- Hellmer, H.H., Kauker, F., Timmermann, R., Determann, J. and Rae, J. 2012. Twenty-first-century warming of a large Antarctic ice-shelf cavity by a redirected coastal current. Nature 485, 225–228. doi:10.1038/nature11064
- Hellmer, H.H., Kauker, F., Timmermann, R. and Hattermann, T. 2017. The fate of the southern Weddell Sea continental shelf in a warming climate. Journal of Climate 30, 4337–4350. doi:10.1175/JCLI-D-16-0420.1
- Reese, R. et al. 2023. The stability of present-day Antarctic grounding lines, Part 2: Onset of irreversible retreat of Amundsen Sea glaciers under current climate on centennial timescales cannot be excluded. The Cryosphere 17, 3761–3783. doi:10.5194/tc-17-3761-2023
- Mouginot, J., Scheuchl, B. and Rignot, E. 2017. MEaSUREs Antarctic Boundaries for IPY 2007–2009 from Satellite Radar, Version 2. NASA NSIDC DAAC. doi:10.5067/AXE4121732AD
- The IMBIE team 2018. Mass balance of the Antarctic Ice Sheet from 1992 to 2017. Nature 558, 219–222. doi:10.1038/s41586-018-0179-y
- Secretariat SCAR (1992, updated 2025). Composite Gazetteer of Antarctica, Scientific Committee on Antarctic Research. Place names on the map. Maintained by the Italian National Antarctic Research Program, hosted by the Australian Antarctic Data Centre. http://placenames.aq/
Tipping points · 5 of 5
Other ways the ice can break
Meltwater can split a shelf from the top down. In March 2002, 2,300 km² of the Larsen B ice shelf shattered in about a week, and the glaciers behind it sped up two to six times. In March 2022, during a heatwave, the last 1,200 km² of the Conger ice shelf in East Antarctica broke apart. About 60% of the ice-shelf area that holds back the ice could be split this way if it filled with meltwater.
Models can be asked where this would happen. In the international ISMIP6 runs, a shelf is removed once it has carried about three quarters of a metre of meltwater a year for ten years in a row, roughly what Larsen A and B had before they broke. In one climate model, low emissions take about 57,000 km² of shelf by 2100; high emissions about 313,000 km², five and a half times more.
Red areas: ice shelves removed by meltwater fracture in that run. The model grid is 32 km, so edges are rough, and it already breaks Larsen C by 2025, which has not happened: read it as where, not when.
Warm deep water is creeping onto the continental shelf. In the Amundsen Sea, about three times the past rate of ocean warming is now likely locked in for this century, even on the lowest emissions path.
Around the continent, sea ice fell to a record low winter maximum of 16.96 million km² in 2023, more than a million below the previous record. It may be a new state that began in 2016; it is too early to call it a tipping point.
On the Peninsula, 87% of glacier fronts have retreated, and the plants growing on bare ground covered about fourteen times more area in 2021 than in 1986.
One feared mechanism, tall ice cliffs collapsing under their own weight, remains contested and is not in the 2026 study.
Sources
- Nowicki, S., Payne, A.J., Goelzer, H. et al. 2020. Experimental protocol for sea level projections from ISMIP6 stand-alone ice sheet models. The Cryosphere 14, 2331–2368. doi:10.5194/tc-14-2331-2020
- Seroussi, H., Nowicki, S. et al. 2020. ISMIP6 Antarctica: a multi-model ensemble of the Antarctic ice sheet evolution over the 21st century. The Cryosphere 14, 3033–3070. doi:10.5194/tc-14-3033-2020
- ISMIP6 21st Century Forcing Datasets, ice-shelf fracture masks prepared by L. Trusel and H. Seroussi (CNRM-CM6-1, SSP1-2.6 and SSP5-8.5). Zenodo. CC BY 4.0. doi:10.5281/zenodo.11176009
- Rack, W. and Rott, H. 2004. Pattern of retreat and disintegration of the Larsen B ice shelf, Antarctic Peninsula. Annals of Glaciology 39, 505–510. doi:10.3189/172756404781814005
- Scambos, T.A., Bohlander, J.A., Shuman, C.A. and Skvarca, P. 2004. Glacier acceleration and thinning after ice shelf collapse in the Larsen B embayment, Antarctica. Geophysical Research Letters 31, L18402. doi:10.1029/2004GL020670
- Walker, C.C. et al. 2024. Multi-decadal collapse of East Antarctica's Conger–Glenzer Ice Shelf. Nature Geoscience 17, 1240–1248. doi:10.1038/s41561-024-01582-3
- Lai, C.-Y. et al. 2020. Vulnerability of Antarctica's ice shelves to meltwater-driven fracture. Nature 584, 574–578. doi:10.1038/s41586-020-2627-8
- Naughten, K.A., Holland, P.R. and De Rydt, J. 2023. Unavoidable future increase in West Antarctic ice-shelf melting over the twenty-first century. Nature Climate Change 13, 1222–1228. doi:10.1038/s41558-023-01818-x
- Purich, A. and Doddridge, E.W. 2023. Record low Antarctic sea ice coverage indicates a new sea ice state. Communications Earth & Environment 4, 314. Extent figures: NSIDC Sea Ice Index. doi:10.1038/s43247-023-00961-9
- Cook, A.J., Fox, A.J., Vaughan, D.G. and Ferrigno, J.G. 2005. Retreating glacier fronts on the Antarctic Peninsula over the past half-century. Science 308, 541–544. doi:10.1126/science.1104235
- Roland, T.P. et al. 2024. Sustained greening of the Antarctic Peninsula observed from satellites. Nature Geoscience 17, 1121–1126. doi:10.1038/s41561-024-01564-5
- Edwards, T.L. et al. 2019. Revisiting Antarctic ice loss due to marine ice-cliff instability. Nature 566, 58–64. doi:10.1038/s41586-019-0901-4
- Mouginot, J., Scheuchl, B. and Rignot, E. 2017. MEaSUREs Antarctic Boundaries for IPY 2007–2009 from Satellite Radar, Version 2. NASA NSIDC DAAC. doi:10.5067/AXE4121732AD
- Secretariat SCAR (1992, updated 2025). Composite Gazetteer of Antarctica, Scientific Committee on Antarctic Research. Place names on the map. Maintained by the Italian National Antarctic Research Program, hosted by the Australian Antarctic Data Centre. http://placenames.aq/
People
Stations on the ice
More than a hundred stations, camps and airfields, run by thirty-one countries under a treaty that keeps the continent for peace and science. Most cling to the coast. A few sit high on the plateau, where the oldest ice and the clearest skies are.
- Open all year
- Summer only
Seven countries claim slices of the continent, three of them overlapping on the Peninsula, and one wedge is claimed by no one. The Antarctic Treaty set every claim aside in 1959: 58 countries are now party to it.
- United Kingdom
- Argentina
- Chile
- Norway
- Australia
- France
- New Zealand
- Unclaimed
The Treaty also guards 76 specially protected areas, entered by permit only, 6 managed areas where several nations work side by side, and 91 historic sites, from explorers' huts to graves. Point at a mark for its story.
Point at a claim to light up its stations; click it for key facts. Facilities as listed by COMNAP in November 2024.
Sources
- COMNAP 2025. Antarctic Facilities List, November 2024. For educational and non-commercial use. www.comnap.aq/antarctic-facilities-information
- Antarctic Treaty Secretariat. Antarctic Specially Protected and Managed Areas (shapefiles, December 2024), status of management plans, and List of Historic Sites and Monuments (accessed 3 Nov 2026). CC BY 4.0. www.ats.aq/e/protected.html
- Antarctic Treaty Secretariat, Parties (accessed 3 Nov 2026). www.ats.aq/devAS/Parties?lang=e
- Claim instruments and recognition: each country's sources are in its card.
Sources
Data
- Morlighem, M. et al. 2020. Deep glacial troughs and stabilizing ridges unveiled beneath the margins of the Antarctic ice sheet. Nature Geoscience 13, 132–137. Data: MEaSUREs BedMachine Antarctica v4.1, NSIDC-0756. doi:10.1038/s41561-019-0510-8
- Ockenden, H., Bingham, R.G., Goldberg, D., Curtis, A. and Morlighem, M. 2026. Complex mesoscale landscapes beneath Antarctica mapped from space. Science 391, 314–319. doi:10.1126/science.ady2532
- Moholdt, G., Pritchard, H. and Maton, J. 2025. RINGS/Bedmap3 grounding line of the Antarctic Ice Sheet. Norwegian Polar Institute. CC0 1.0. doi:10.21334/npolar.2025.d1062d2a
- Pritchard, H.D. et al. 2025. Bedmap3 updated ice bed, surface and thickness gridded datasets for Antarctica. Scientific Data 12, 414. CC BY 4.0. doi:10.1038/s41597-025-04672-y
- Leong, W.J. and Horgan, H.J. 2020. DeepBedMap: a deep neural network for resolving the bed topography of Antarctica. The Cryosphere 14, 3687–3705. Tile seams feathered by GLOBAÏA. doi:10.5194/tc-14-3687-2020
- Rignot, E., Mouginot, J. and Scheuchl, B. 2017. MEaSUREs InSAR-Based Antarctica Ice Velocity Map, Version 2. NASA NSIDC DAAC. doi:10.5067/D7GK8F5J8M8R
- Rignot, E., Mouginot, J. and Scheuchl, B. 2011. Ice flow of the Antarctic ice sheet. Science 333, 1427–1430. doi:10.1126/science.1208336
- Jobard, B. and Lefer, W. 1997. Creating evenly-spaced streamlines of arbitrary density. Visualization in Scientific Computing '97, Springer, 43–55. The method behind the lines. doi:10.1007/978-3-7091-6876-9_5
- Mouginot, J., Scheuchl, B. and Rignot, E. 2017. MEaSUREs Antarctic Boundaries for IPY 2007–2009 from Satellite Radar, Version 2. NASA NSIDC DAAC. doi:10.5067/AXE4121732AD
- Wright, A. and Siegert, M. 2012. A fourth inventory of Antarctic subglacial lakes. Antarctic Science 24, 659–664. doi:10.1017/S095410201200048X
- Livingstone, S.J. et al. 2022. Subglacial lakes and their changing role in a warming climate. Nature Reviews Earth & Environment 3, 106–124. Inventory data CC BY 4.0, University of Sheffield. doi:10.1038/s43017-021-00246-9
- Livingstone, S.J. et al. 2022. Global inventory of subglacial lakes (dataset). University of Sheffield. CC BY 4.0. doi:10.15131/shef.data.18094037.v1
- Smith, B.E., Fricker, H.A., Joughin, I.R. and Tulaczyk, S. 2009. An inventory of active subglacial lakes in Antarctica detected by ICESat (2003–2008). Journal of Glaciology 55, 573–595. doi:10.3189/002214309789470879
- Siegfried, M.R. and Fricker, H.A. 2018. Thirteen years of subglacial lake activity in Antarctica from multi-mission satellite altimetry. Annals of Glaciology 59(76pt1), 42–55. Outlines from Siegfried2021-GRL v1.0 (Zenodo 4914107), Copyright (c) 2021 Matthew R. Siegfried, BSD 3-Clause License, provided as is without warranty. doi:10.1017/aog.2017.36
- Wilson, S.F., Hogg, A.E. et al. 2025. Detection of 85 new active subglacial lakes in Antarctica from a decade of CryoSat-2 data. Nature Communications 16, 8311. doi:10.1038/s41467-025-63773-9
- Wilson et al. 2025, active subglacial lake outlines and time series (dataset). Zenodo. CC BY 4.0. doi:10.5281/zenodo.16330564
- Studinger, M. et al. 2003. Ice cover, landscape setting, and geological framework of Lake Vostok, East Antarctica. Earth and Planetary Science Letters 205, 195–210. doi:10.1016/S0012-821X(02)01041-5
- Bell, R.E., Studinger, M., Shuman, C.A., Fahnestock, M.A. and Joughin, I. 2007. Large subglacial lakes in East Antarctica at the onset of fast-flowing ice streams. Nature 445, 904–907. doi:10.1038/nature05554
- Le Brocq, A.M. et al. 2013. Evidence from ice shelves for channelized meltwater flow beneath the Antarctic Ice Sheet. Nature Geoscience 6, 945–948. Modelled water flux. doi:10.1038/ngeo1977
- Matsuoka, K. et al. 2021. Quantarctica, an integrated mapping environment for Antarctica, the Southern Ocean, and sub-Antarctic islands. Environmental Modelling & Software 140, 105015. Several layers were gathered through it. doi:10.1016/j.envsoft.2021.105015
- Tollenaar, V., Zekollari, H., Lhermitte, S., Tax, D.M.J., Debaille, V., Goderis, S., Claeys, P. and Pattyn, F. 2022. Unexplored Antarctic meteorite collection sites revealed through machine learning. Science Advances 8, eabj8138. doi:10.1126/sciadv.abj8138
- Tollenaar, V. et al. 2021. Datasets for 'Unexplored Antarctic meteorite collection sites revealed through machine learning'. Zenodo. CC BY 4.0. Find positions from the Meteoritical Bulletin Database. doi:10.5281/zenodo.5749753
- Tollenaar, V., Zekollari, H., Kittel, C., Farinotti, D., Lhermitte, S., Debaille, V., Goderis, S., Claeys, P., Joy, K.H. and Pattyn, F. 2024. Antarctic meteorites threatened by climate warming. Nature Climate Change 14, 340–343. doi:10.1038/s41558-024-01954-y
- Tollenaar, V. et al. 2024. Datasets for 'Antarctic meteorites threatened by climate warming' (stranding zones in 2050 and 2100). Zenodo. CC BY-SA 4.0. doi:10.5281/zenodo.10579625
- Data: Brigham Young University (BYU), Antarctic Iceberg Tracking Database, v8.0. Budge, J.S. and Long, D.G. 2018. A Comprehensive Database for Antarctic Iceberg Tracking Using Scatterometer Data. IEEE JSTARS 11, 434–442. Positions from the Consolidated Antarctic Iceberg Database v8.0 (1976 to April 2026); sizes from the Antarctic Iceberg Statistical Database v7.1 (to August 2023), BYU and the US National Ice Center. doi:10.1109/JSTARS.2017.2784186
- Smith, B., Jelley, B.P., Dickinson, S., Sutterley, T., Neumann, T. and Harbeck, K. 2026. ATLAS/ICESat-2 L3B Gridded Antarctic and Greenland Height Change (ATL15), version 6. NASA National Snow and Ice Data Center DAAC. Seven-year rate, April 2019 to April 2026. doi:10.5067/ATLAS/ATL15.006
- Winkelmann, R., Garbe, J., Donges, J.F. and Albrecht, T. 2026. Mapping tipping risks from Antarctic ice basins under global warming. Nature Climate Change 16, 341–349. doi:10.1038/s41558-025-02554-0
- The IMBIE team 2018. Mass balance of the Antarctic Ice Sheet from 1992 to 2017. Nature 558, 219–222. doi:10.1038/s41586-018-0179-y
- Adusumilli, S., Fricker, H.A., Medley, B., Padman, L. and Siegfried, M.R. 2020. Interannual variations in meltwater input to the Southern Ocean from Antarctic ice shelves. Nature Geoscience 13, 616–620. doi:10.1038/s41561-020-0616-z
- Adusumilli et al. 2020, Antarctic ice-shelf basal melt rates, 2010–2018, 500 m (dataset). UC San Diego Library. CC BY 4.0. doi:10.6075/J04Q7SHT
- Rignot, E., Mouginot, J., Morlighem, M., Seroussi, H. and Scheuchl, B. 2014. Widespread, rapid grounding line retreat of Pine Island, Thwaites, Smith, and Kohler glaciers, West Antarctica, from 1992 to 2011. Geophysical Research Letters 41, 3502–3509. doi:10.1002/2014GL060140
- Graham, A.G.C. et al. 2022. Rapid retreat of Thwaites Glacier in the pre-satellite era. Nature Geoscience 15, 706–713. doi:10.1038/s41561-022-01019-9
- Hill, E.A. et al. 2023. The stability of present-day Antarctic grounding lines, Part 1: No indication of marine ice sheet instability in the current geometry. The Cryosphere 17, 3739–3759. doi:10.5194/tc-17-3739-2023
- Reese, R. et al. 2023. The stability of present-day Antarctic grounding lines, Part 2: Onset of irreversible retreat of Amundsen Sea glaciers under current climate on centennial timescales cannot be excluded. The Cryosphere 17, 3761–3783. doi:10.5194/tc-17-3761-2023
- Secretariat SCAR (1992, updated 2025). Composite Gazetteer of Antarctica, Scientific Committee on Antarctic Research. Place names on the map. Maintained by the Italian National Antarctic Research Program, hosted by the Australian Antarctic Data Centre. http://placenames.aq/
- Mercer, J.H. 1978. West Antarctic ice sheet and CO2 greenhouse effect: a threat of disaster. Nature 271, 321–325. doi:10.1038/271321a0
- Feldmann, J. and Levermann, A. 2015. Collapse of the West Antarctic Ice Sheet after local destabilization of the Amundsen Basin. PNAS 112, 14191–14196. doi:10.1073/pnas.1512482112
- van Wyk de Vries, M., Bingham, R.G. and Hein, A.S. 2018. A new volcanic province: an inventory of subglacial volcanoes in West Antarctica. Geological Society, London, Special Publications 461, 231–248. doi:10.1144/SP461.7
- Lough, A.C. et al. 2013. Seismic detection of an active subglacial magmatic complex in Marie Byrd Land, Antarctica. Nature Geoscience 6, 1031–1035. doi:10.1038/ngeo1992
- Greenbaum, J.S. et al. 2015. Ocean access to a cavity beneath Totten Glacier in East Antarctica. Nature Geoscience 8, 294–298. doi:10.1038/ngeo2388
- Brancato, V. et al. 2020. Grounding line retreat of Denman Glacier, East Antarctica, measured with COSMO-SkyMed radar interferometry data. Geophysical Research Letters 47, e2019GL086291. doi:10.1029/2019GL086291
- Rignot, E., Jacobs, S., Mouginot, J. and Scheuchl, B. 2013. Ice-shelf melting around Antarctica. Science 341, 266–270. doi:10.1126/science.1235798
- Hellmer, H.H., Kauker, F., Timmermann, R., Determann, J. and Rae, J. 2012. Twenty-first-century warming of a large Antarctic ice-shelf cavity by a redirected coastal current. Nature 485, 225–228. doi:10.1038/nature11064
- Hellmer, H.H., Kauker, F., Timmermann, R. and Hattermann, T. 2017. The fate of the southern Weddell Sea continental shelf in a warming climate. Journal of Climate 30, 4337–4350. doi:10.1175/JCLI-D-16-0420.1
- Nowicki, S., Payne, A.J., Goelzer, H. et al. 2020. Experimental protocol for sea level projections from ISMIP6 stand-alone ice sheet models. The Cryosphere 14, 2331–2368. doi:10.5194/tc-14-2331-2020
- Seroussi, H., Nowicki, S. et al. 2020. ISMIP6 Antarctica: a multi-model ensemble of the Antarctic ice sheet evolution over the 21st century. The Cryosphere 14, 3033–3070. doi:10.5194/tc-14-3033-2020
- ISMIP6 21st Century Forcing Datasets, ice-shelf fracture masks prepared by L. Trusel and H. Seroussi (CNRM-CM6-1, SSP1-2.6 and SSP5-8.5). Zenodo. CC BY 4.0. doi:10.5281/zenodo.11176009
- Rack, W. and Rott, H. 2004. Pattern of retreat and disintegration of the Larsen B ice shelf, Antarctic Peninsula. Annals of Glaciology 39, 505–510. doi:10.3189/172756404781814005
- Scambos, T.A., Bohlander, J.A., Shuman, C.A. and Skvarca, P. 2004. Glacier acceleration and thinning after ice shelf collapse in the Larsen B embayment, Antarctica. Geophysical Research Letters 31, L18402. doi:10.1029/2004GL020670
- Walker, C.C. et al. 2024. Multi-decadal collapse of East Antarctica's Conger–Glenzer Ice Shelf. Nature Geoscience 17, 1240–1248. doi:10.1038/s41561-024-01582-3
- Lai, C.-Y. et al. 2020. Vulnerability of Antarctica's ice shelves to meltwater-driven fracture. Nature 584, 574–578. doi:10.1038/s41586-020-2627-8
- Naughten, K.A., Holland, P.R. and De Rydt, J. 2023. Unavoidable future increase in West Antarctic ice-shelf melting over the twenty-first century. Nature Climate Change 13, 1222–1228. doi:10.1038/s41558-023-01818-x
- Purich, A. and Doddridge, E.W. 2023. Record low Antarctic sea ice coverage indicates a new sea ice state. Communications Earth & Environment 4, 314. Extent figures: NSIDC Sea Ice Index. doi:10.1038/s43247-023-00961-9
- Cook, A.J., Fox, A.J., Vaughan, D.G. and Ferrigno, J.G. 2005. Retreating glacier fronts on the Antarctic Peninsula over the past half-century. Science 308, 541–544. doi:10.1126/science.1104235
- Roland, T.P. et al. 2024. Sustained greening of the Antarctic Peninsula observed from satellites. Nature Geoscience 17, 1121–1126. doi:10.1038/s41561-024-01564-5
- Edwards, T.L. et al. 2019. Revisiting Antarctic ice loss due to marine ice-cliff instability. Nature 566, 58–64. doi:10.1038/s41586-019-0901-4
- Che-Castaldo, C., Humphries, G. and Lynch, H. 2023. Antarctic Penguin Biogeography Project: database of abundance and distribution for the Adélie, chinstrap, gentoo, emperor, macaroni and king penguin south of 60 S. Biodiversity Data Journal 11, e101476. Data CC BY 4.0. doi:10.3897/BDJ.11.e101476
- Mapping Application for Penguin Populations and Projected Dynamics (MAPPPD) database, SCAR-AntOBIS. CC BY 4.0. doi:10.48361/zftxkr
- Fretwell, P. 2024. Emperor penguin colony locations derived from satellite remote sensing across Antarctica, 2023. NERC EDS UK Polar Data Centre. Contains public sector information licensed under the Open Government Licence v3.0. doi:10.5285/fb0547e4-d2c1-4580-8c98-182f1da7d9ae
- Fretwell, P.T. et al. 2012. An emperor penguin population estimate: the first global, synoptic survey of a species from space. PLoS ONE 7, e33751. doi:10.1371/journal.pone.0033751
- Fretwell, P.T., Boutet, A. and Ratcliffe, N. 2023. Record low 2022 Antarctic sea ice led to catastrophic breeding failure of emperor penguins. Communications Earth & Environment 4, 273. doi:10.1038/s43247-023-00927-x
- COMNAP 2025. Antarctic Facilities List, November 2024. For educational and non-commercial use. www.comnap.aq/antarctic-facilities-information
- Antarctic Treaty Secretariat. Antarctic Specially Protected and Managed Areas (shapefiles, December 2024), status of management plans, and List of Historic Sites and Monuments (accessed 3 Nov 2026). CC BY 4.0. www.ats.aq/e/protected.html
- Antarctic Treaty Secretariat, Parties (accessed 3 Nov 2026). www.ats.aq/devAS/Parties?lang=e
Polar stereographic projection (EPSG:3031), true to scale at 71°S. Plates at about 957 m per pixel.
This page is for education only. GLOBAÏA is a non-profit; nothing here is sold or used commercially. Every dataset stays the work of the people listed above, under their own terms: please cite them, not this page, if you reuse their data.
Sea level0 m
… of today's grounded ice rests on bed below this level
Waiting to load the bed
Profile along the cut