An interactive 3D globe with refractive glass spheres sized by the volumes of Earth's water & air, living biomass, and human-made mass.
Loads the 3D globe
Atmosphere
Tone mapping
Sun position
Surface
Advanced: appearance
Glass (Air)
Water
Shared look
Water ripples
Water volume
Core tint (water)
Wobble (all spheres)
Welcome to Sfera
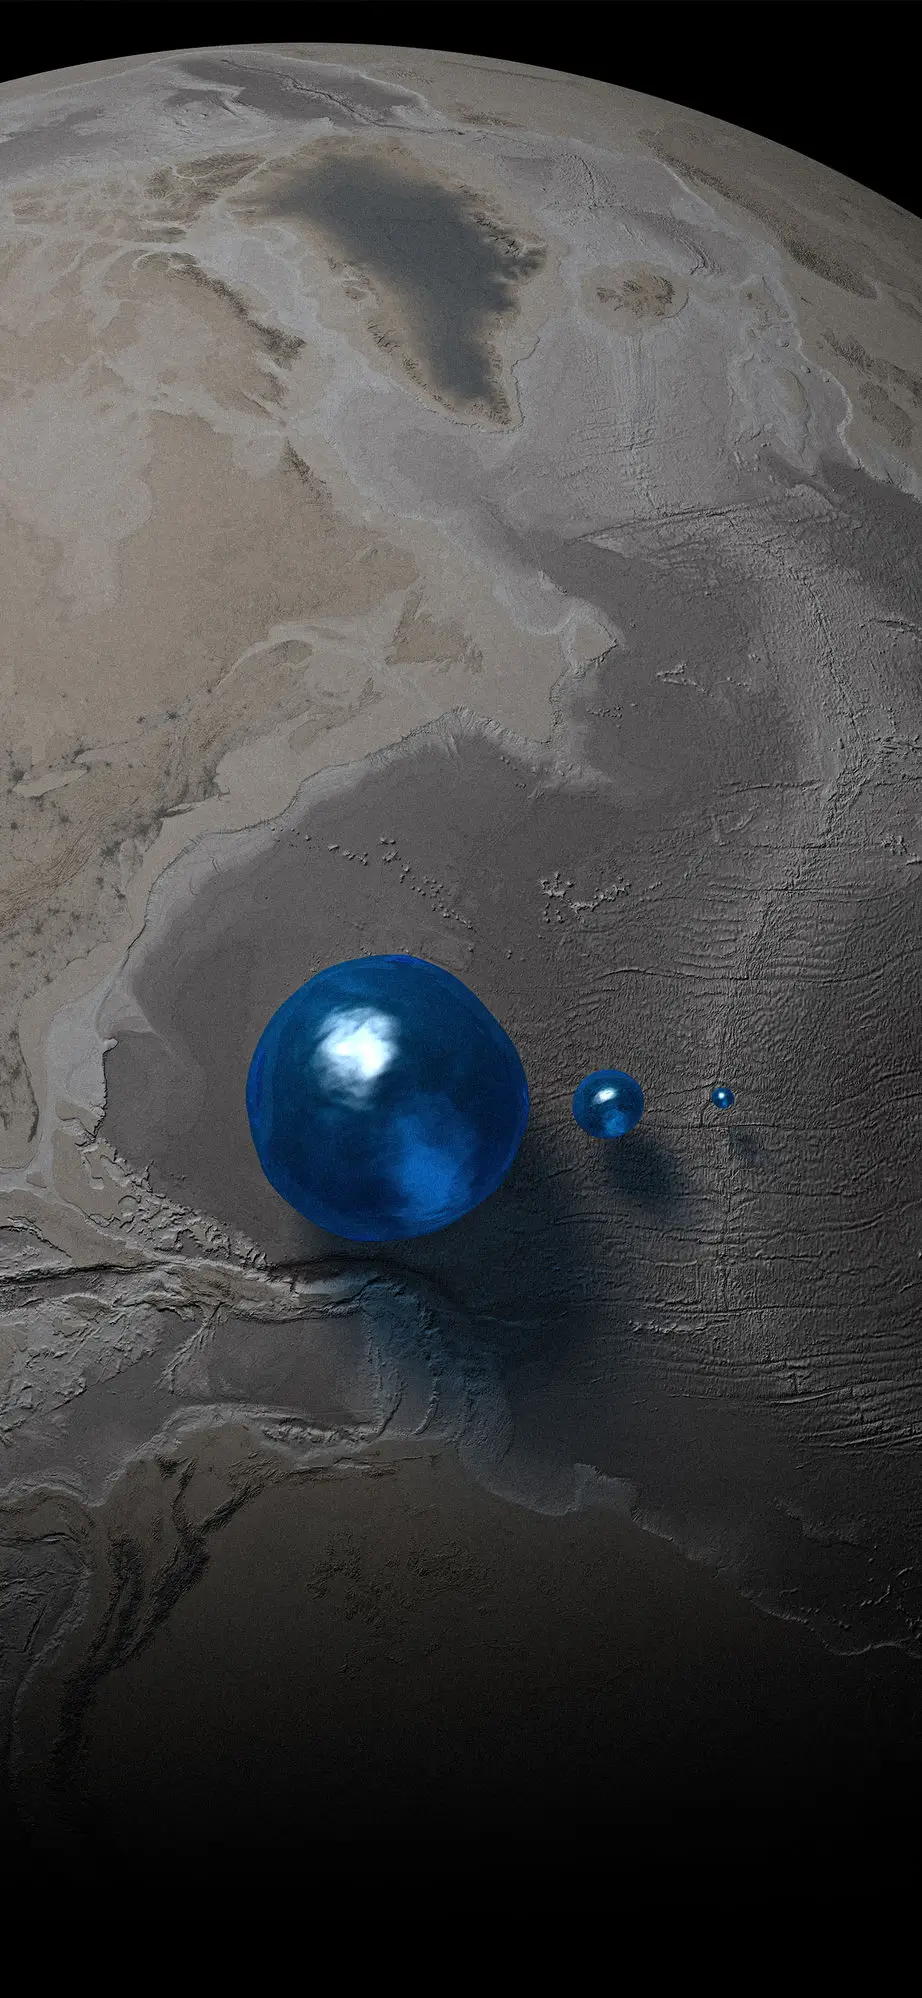
Beside Earth, you see two small spheres. They are not symbolic — they are drawn to scale by volume. Every drop of water on the planet, gathered. Every breath of air, gathered. Each into a single globe.
The surprise is how small they are. All the oceans, rivers, ice and groundwater. The entire atmosphere. A few modest spheres, dwarfed by the world that holds them.
This is the thin envelope that makes a planet habitable — and the only one we have. Toggle the layers to add biomass, freshwater, human-made mass. See what is abundant, what is scarce, and what we have come to match in weight.
About Sfera
What you are seeing
Every sphere on this page answers the same simple question: if you gathered every gram of something on Earth into a single ball, how big would that ball be? The answers sit beside the planet itself (radius 6,371 km), drawn at the same true scale, so that water, air, life, and every human-made object can be compared at a glance.
Two views ship together. The Global view places the spheres beside a full planet — the natural frame for oceans, atmosphere and ice sheets. The Local view drops them above a real 3D landscape — a Himalayan ridge, a coastline, a city block — so that the tiny ones, the ones that would disappear next to Earth, finally become legible.
The geometry of volume
A sphere's volume grows with the cube of its radius: V = 4⁄3 π r³, and the radius grows with the cube root of the volume: r = 3√(3V ∕ 4π). The practical consequence is striking: a sphere with 1,000× more volume is only 10× wider. Doubling the size of a ball means containing eight times more — our eyes do not naturally think this way, and that is part of why these spheres surprise.
It is also why several spheres that look almost identical hide huge differences:
- Total water ≈ Ocean — oceans are 96.5% of all water; the remaining 3.5% barely widens the sphere.
- Freshwater (all) ≈ Ice — about 69% of fresh water is frozen, so the liquid and vapor additions only nudge the radius outward.
- Water vapor is tiny — just 0.001% of all water — yet it drives every storm, cloud and rainfall on Earth.
The water spheres
Earth's total water, pooled into a single ball, forms a sphere only 692 km in radius — just 0.13% of the planet's volume. Oceans are 96.5% of that mass, so the Ocean sphere barely shrinks it. The remaining 3.5% is freshwater, and about 69% of that is locked as ice. We draw that ice as a rounded cube rather than a sphere — a shape that reads as the crystalline solid it is — scaled to preserve the same volume (≈ 2.58 × 10⁷ km³, a cube ≈ 295 km on each side). The liquid freshwater that remains (groundwater, lakes, rivers) shrinks to ≈ 176 km across, and atmospheric water vapor, which drives every storm and rainfall, is a droplet just 15 km wide.
The "Air" sphere
The atmosphere is surprisingly heavy — about 5.15 × 10¹⁸ kg of air, measured from satellites and surface-pressure readings. But most of that mass is extremely thin: at 30 km up, the air is already less than one percent of its sea-level density. If every molecule were squeezed down to the density you breathe right now (about 1.225 kg/m³), all that air would collapse into a sphere of radius ≈1,000 km — bigger than the sphere of Total Water, yet still smaller than Earth's Moon.
Dry vs. wet biomass
Scientists measure life in several different units, so we convert everything through one shared chain. Each step is a real convention from the ecological literature:
- Carbon (Gt C) — the gold-standard metric used by Bar-On et al. (2018, PNAS). Every kingdom of life is first reported by its carbon content. Carbon makes up about half of dry plant matter and a little less than half of dry microbes and animals.
- Dry mass = Carbon × 2.25 — what remains once every drop of tissue water is removed from an organism. The dry mass of all life on Earth is about 1.1 trillion tonnes.
- Wet (fresh) mass = Dry × tissue-water factor — what a living thing actually weighs, water and all. Plants are ~50% water (×2), microbes ~70% water (×3.3), animals ~67% water (×3). The global total is about 2.2 trillion tonnes.
At water density, one gigatonne of biomass becomes one cubic kilometre, so the spheres are directly size-comparable across kingdoms. Use the Dry / Wet toggle in the side panel to switch between the two views of life.
The Anthropocene crossover
Around 2020 — give or take six years — the total mass of all human-made things still in use (concrete, aggregates, bricks, asphalt, metals, plastic, wood, glass) equalled the dry mass of every living thing on Earth. Our built world now rivals the weight of the biosphere itself. The stock is doubling roughly every twenty years, a pace no natural biological process comes close to matching. On a wet-biomass basis the crossover came earlier, around 2013.
Each anthromass sphere is sized by the real-world bulk density of the material — mass divided by how densely it actually sits in the world. Concrete (2.4 t/m³) and metals (7.8 t/m³) pack small; aggregates (1.6 t/m³) and wood (0.6 t/m³) spread wide. That is why 35 gigatonnes of metal fits into only 4.5 km³, while an equal mass of wood would fill more than eight times that volume.
Scale and the invisible
At planet scale, life is almost invisible. Humanity in total is about 420 million tonnes of wet mass — a sphere just 0.31 km across, set next to Earth's 6,371 km radius. Wild land mammals form an even smaller droplet, roughly 170 m in radius. Many of the spheres on this page are too tiny to see from here, and that is part of the point: the planetary disproportion is itself the data. Open the Local view and the same spheres drop into a real landscape — a Himalayan ridge, a city district — where they become tangible again.
Annual flows
The Annual flows group shows one year's worth of each global output — every emission, every tonne of steel and concrete produced, every bucket of water withdrawn. To make invisible gases directly comparable to solids, we compress them to their densest everyday form: CO₂ becomes dry ice, methane becomes the liquefied natural gas shipped across oceans, nitrous oxide and ammonia become liquids. At these densities, one year of human CO₂ emissions (42 Gt) forms a sphere of ≈ 27 km³; one year of concrete (31 Gt) about 13 km³; Haber–Bosch fixed nitrogen (150 Mt N, as liquid ammonia) only 0.27 km³.
The largest sphere in the group is the most unexpected: anthropogenic earth-moving. Mines, construction sites and ploughs together shift around 25 times more rock and soil every year than every river on Earth combined — a sphere ≈ 3 km in radius. Humanity is now the planet's dominant geomorphic agent.
Cumulative impact
The Cumulative impact group pools not a single year but everything since humans began counting. All CO₂ ever emitted since 1750 — fossil fuels plus land clearance, about 2,600 Gt — forms a sphere of dry ice ≈ 1,700 km³, roughly the size of a small city. All soil mobilised by agriculture since the Neolithic (~30,000 Gt over 10,000 years) dwarfs every other sphere at ≈ 12,500 km³: the plough has been a planetary force since long before the steam engine.
Polar ice lost since 2002, measured directly by NASA's GRACE satellites from orbit, already amounts to ≈ 8,600 km³ — a cube of ice 20 km on each side, melted in a single human generation and still accelerating. All plastic ever produced (8.3 Gt, 1950–2015) is a comparatively modest ≈ 7 km³, yet 60% of it is already waste. And the 20th century's industrial whaling removed a sphere of wet whale biomass roughly 0.8 km across — about ten times what all wild marine mammals together weigh today.
The Local view
The Local view drops the spheres above a real patch of Earth's surface — typically 30–60 km across. Satellite imagery from Esri World Imagery (Maxar, Earthstar Geographics) is draped onto a genuine digital elevation model from AWS Open Data Terrain Tiles (Mapzen/Terrarium), a grid of height readings that turns flat pixels into real topography. Vertical relief is exaggerated by a factor of two, so that mountain ranges feel like mountain ranges. Pick a preset (Himalayas, Tokyo, Sahara…), enter coordinates, or click anywhere on a world map to place yourself there.
Limitations
These spheres are illustrative scale comparisons, not geographic distributions. The "Air" sphere is a thought experiment: the real atmosphere is highly rarefied, with three-quarters of its mass sitting within the lowest 11 km, and it could never actually collapse to sea-level density. Biomass is an instantaneous standing stock, not a flux — it measures how much life is alive right now, not how fast carbon, nitrogen and water move through it. Human-made mass is the in-use stock around 2020, not cumulative historical extraction; demolished buildings and industrial waste are tracked separately in the Cumulative-impact group. Annual-flow spheres compress gases to solid or liquid form (CO₂ as dry ice, CH₄ as LNG, N₂O as liquid, NH₃ as liquid ammonia); real atmospheric CO₂ at everyday pressure would be roughly 800× larger than the sphere shown. Several large spheres (water, air, freshwater, cumulative erosion and ice loss) exceed the Local-view slab and are hidden there — open the Global view to see them at planetary scale.
Sources & provenance
- Water inventory — USGS Water Science School / Gleick 1996 synthesis; ocean salinity adjustment following Eakins & Sharman 2010. USGS page.
- Atmosphere mass — Trenberth, K. E., & Smith, L. (2005). The mass of the atmosphere: A constraint on global analyses. J. Climate 18, 864–875. doi:10.1175/JCLI-3299.1
- Biomass (all kingdoms) — Bar-On, Y. M., Phillips, R., & Milo, R. (2018). The biomass distribution on Earth. PNAS 115(25): 6506–6511. doi:10.1073/pnas.1711842115
- Wild mammals (present-day) — Greenspoon, L., et al. (2023). The global biomass of wild mammals. PNAS 120(10): e2204892120. doi:10.1073/pnas.2204892120
- Mammal biomass since 1850 + human biomass update — Greenspoon, L., et al. (2025). The global biomass of mammals since 1850. Nature Communications 16:8338. doi:10.1038/s41467-025-63888-5
- Human-made mass (2020 stock) — Elhacham, E., et al. (2020). Global human-made mass exceeds all living biomass. Nature 588, 442–444. doi:10.1038/s41586-020-3010-5
- Cumulative + annual material stocks and flows — Krausmann, F., et al. (2017). Global socioeconomic material stocks rise 23-fold over the 20th century. PNAS 114:1880–1885. doi:10.1073/pnas.1613773114
- CO₂ emissions (annual + cumulative) — Friedlingstein, P., et al. (2019). Global Carbon Budget 2019. Earth Syst. Sci. Data 11:1783–1838. doi:10.5194/essd-11-1783-2019
- Methane budget — Saunois, M., et al. (2020). The Global Methane Budget 2000–2017. Earth Syst. Sci. Data 12:1561–1623. doi:10.5194/essd-12-1561-2020
- N₂O budget — Tian, H., et al. (2020). A comprehensive quantification of global nitrous-oxide sources and sinks. Nature 586:248–256. doi:10.1038/s41586-020-2780-0
- Anthropogenic sediment flux — Cooper, A. H., et al. (2018). Humans are the most significant global geomorphological driving force of the 21st century. Anthropocene Review 5:222–229. doi:10.1177/2053019618800234
- Soil eroded since agriculture — Wang, Z., Van Oost, K., & Govers, G. (2019). Quantifying cumulative anthropogenic soil mobilisation since the Neolithic. The Holocene. doi:10.1177/0959683618810401
- Water withdrawal — Qin, Y., et al. (2019). Flexibility and intensity of global water use. Nature Sustainability 2:515–523. doi:10.1038/s41893-019-0294-2
- Plastic (annual + cumulative) — Geyer, R., Jambeck, J. R., & Law, K. L. (2017). Production, use, and fate of all plastics ever made. Science Advances 3:e1700782. doi:10.1126/sciadv.1700782
- Dam-fragmented rivers — Grill, G., et al. (2019). Mapping the world's free-flowing rivers. Nature 569:215–221. doi:10.1038/s41586-019-1111-9
- Reservoir capacity — FAO AQUASTAT Global Dams database. aquastat.fao.org.
- Polar ice loss — Wiese, D. N., et al. (2019). NASA JPL GRACE/GRACE-FO mascon ocean, ice, and hydrology products. PO.DAAC dataset.
- Industrial whaling catch — Rocha, R. C. Jr, Clapham, P. J., & Ivashchenko, Y. V. (2014). Emptying the oceans: a summary of industrial whaling catches in the 20th century. Marine Fisheries Review 76(4):37–48. spo.nmfs.noaa.gov.
- Dataset / database — Chure, G., et al. (2022). Anthroponumbers.org: A quantitative database of human impacts on Planet Earth. Patterns 3:100552. doi:10.1016/j.patter.2022.100552 · anthroponumbers.org
Educational purpose
Sfera is a non-commercial educational project by GLOBAÏA, a non-profit working to make planetary-scale scientific knowledge accessible to a general audience. Every value on this page is drawn from peer-reviewed literature or open-access databases, all of which are listed above. The visualisation and its captions are intended for science communication and education — they are not a primary research source, and should not be cited in place of the underlying papers.
Credits
Designed, built and maintained by GLOBAÏA. Source code and data in the repo; corrections and contributions welcome.
Suggested citation
GLOBAÏA (2026). Sfera: Planetary-scale comparison spheres [interactive visualisation]. globaia.org/sfera/. Accessed .
Open the Local view?
This sphere is best seen next to a real landscape. Open the Local view in this tab?