Habitability · Heat stress
Wet-Bulb Globe Temperature
Where humans can still work outdoors — and where they soon cannot.
Air temperature alone is a poor guide to what the body actually feels. Wind, sun, and especially humidity decide whether sweat can evaporate — and evaporation is the only way the human body sheds the heat it makes by being alive. When the surrounding air is too humid, sweat stays on the skin, the body's core temperature rises, and within hours, then minutes, even a fit person resting in the shade is in danger.
Wet-bulb globe temperature (WBGT) is the standard, century-old way to compress all four ingredients — heat, humidity, wind, solar radiation — into a single number that maps cleanly to how long a person can safely work in the sun. Athletes, soldiers, and outdoor labourers have used it for decades. The maps below extend it to every quarter-degree of the planet, today and at three levels of future warming.
Data: Kong & Huber (2025), Scientific Data 12:246, computed with the gold-standard Liljegren method from ERA5 reanalysis (1994–2023) and a 15-model CMIP6 ensemble.
See also — Human Climate Niches, the long-run framing of where mean annual temperature still falls inside the band our species has inhabited for six millennia.
How to read these maps
The five heat-stress zones
The U.S. National Institute for Occupational Safety and Health (NIOSH) defined four temperature breaks in 1986 — expressed as round Fahrenheit numbers (80, 85, 88, 90 °F) — that delimit how long a healthy, acclimatised, unencumbered person can work in direct sunlight before heat stress becomes dangerous. The same five colour bands run through every map on this page.
-
< 26.7 °C / < 80 °F
Safe
No restrictions on outdoor work for healthy adults. Most temperate regions sit here year-round.
The body sheds metabolic heat through sweat and convection without strain. Hydration and shade matter, but the limit is endurance, not survival.
-
26.7–29.4 °C / 80–85 °F
Caution
Sunlit labour stresses the body after ~45 min. Take 15-min breaks every hour.
Heat exhaustion becomes plausible on long shifts. Construction crews, farm workers and outdoor athletes start losing productivity here; emergency rooms see the first heat-related visits.
-
29.4–31.1 °C / 85–88 °F
High risk
Stress after ~30 min. Take 30-min breaks every hour.
Heat cramps and exhaustion are common; vulnerable people (elderly, pregnant, chronically ill) face acute risk. Schools delay PE, militaries scale back drills, and worker-protection laws kick in across many countries.
-
31.1–32.2 °C / 88–90 °F
Severe
Stress after ~20 min. Take 40-min breaks every hour.
Heatstroke risk rises sharply — core temperatures climb above 40 °C within an hour of sustained exertion. Hospital admissions spike; outdoor work in protective gear becomes life-threatening. Power grids strain under cooling demand.
-
> 32.2 °C / > 90 °F
Extreme
Stress after ~15 min. Take 45-min breaks every hour.
Approaching the physiological ceiling for human survival. Lethal heatstroke can occur within an hour even at rest in the shade; mortality climbs across whole populations. Cities issue red alerts, mass-casualty plans activate, and entire days of outdoor activity become unsafe — the heat-stress regime that killed 70 000 Europeans in the 2003 wave and 1 400 in the 2024 Hajj.
Thresholds follow the 1986 NIOSH standard for occupational heat exposure on healthy, acclimatised, unencumbered workers performing moderate labour. Children, the elderly, the sick, and anyone wearing protective gear lose ground earlier; in dense urban heat islands, conditions on a sidewalk can run several degrees above the regional WBGT.
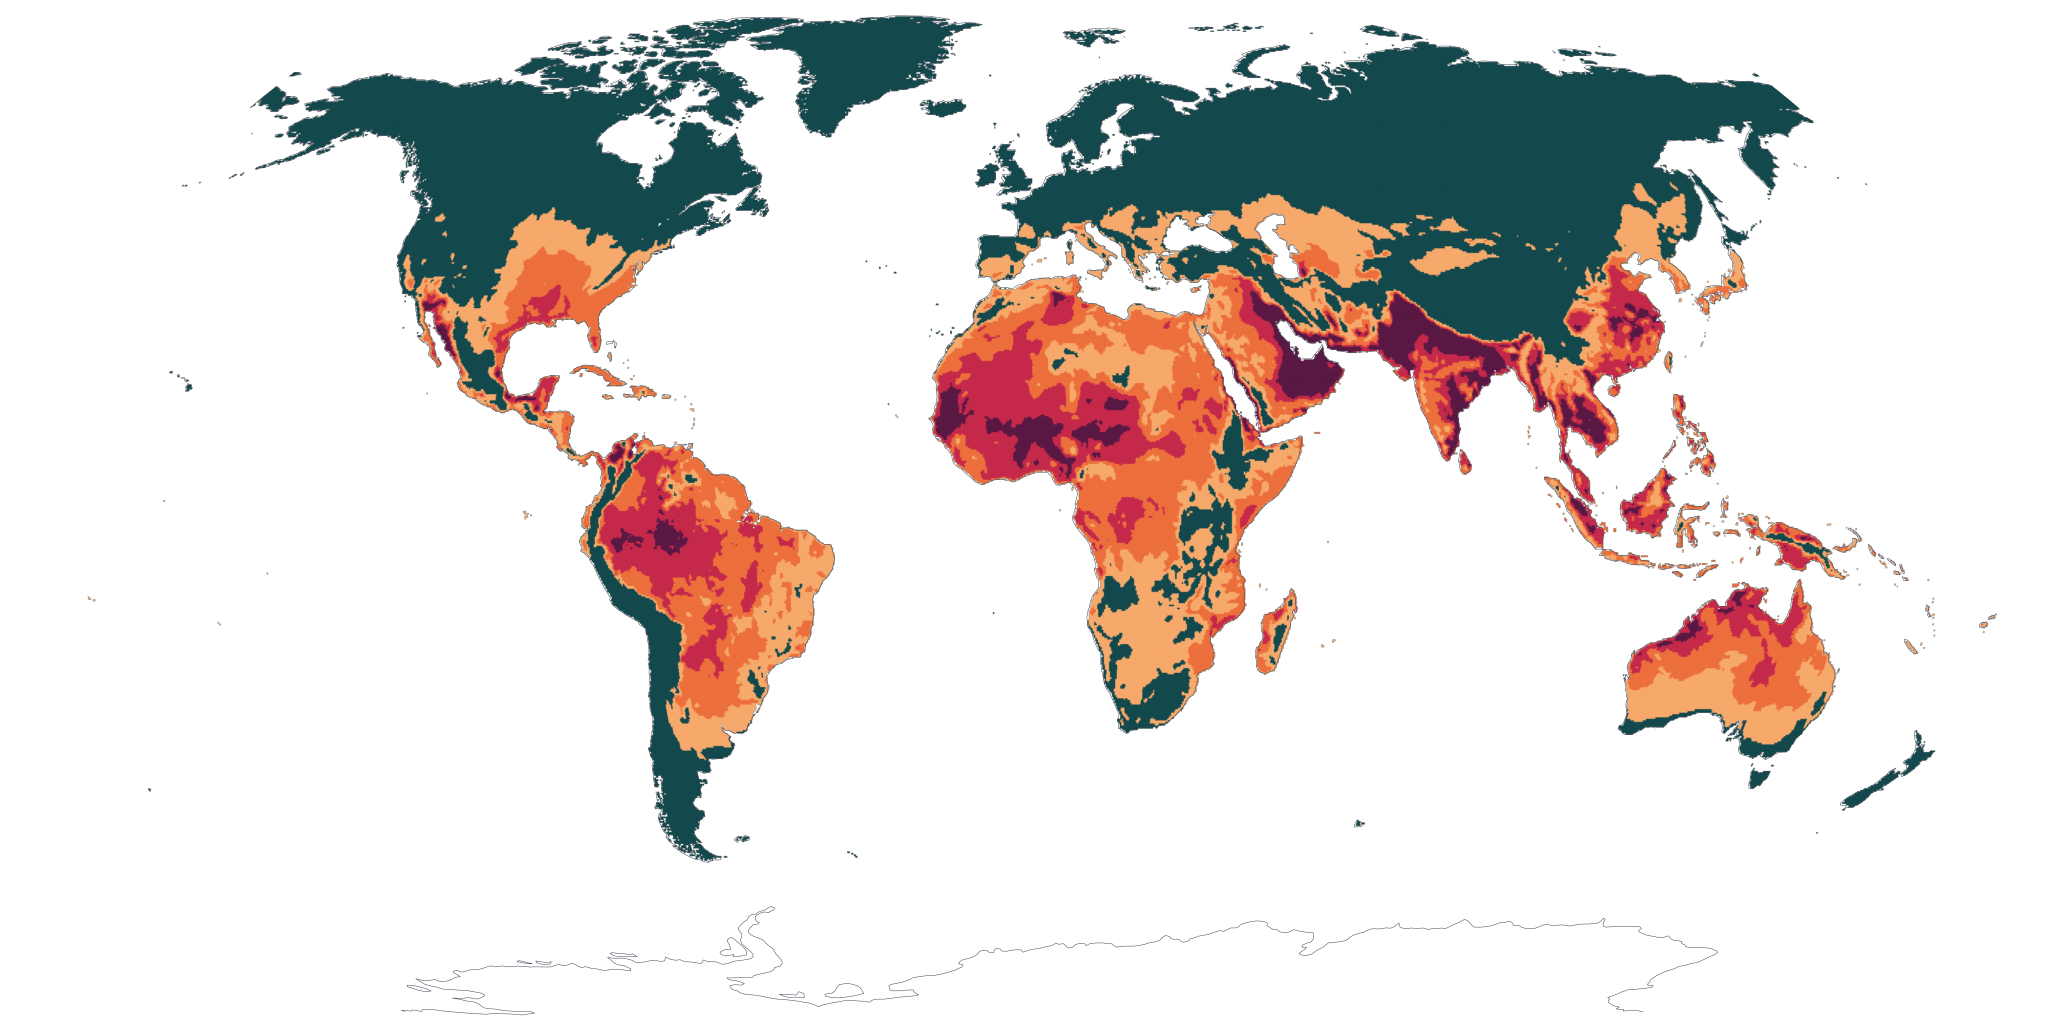
Panel 1 · Today
The hottest 5 % of hours
When the heat is at its worst, where on Earth is the human body already past the line? For every quarter-degree cell, the map plots the 95th-percentile wet-bulb globe temperature of its hottest month — the conditions met during the worst one-in-twenty hours of the worst season. ERA5 hourly reanalysis, averaged over 1994–2023.
Heat-stress thresholds
Wet-bulb globe temperature (WBGT) combines heat, humidity, wind and sun into a single number that describes what the body actually feels.
- < 26.7 °C / < 80 °FNo restrictions on outdoor work.
- 26.7 – 29.4 °C / 80 – 85 °FSunlit labour stresses the body after 45 min.
Take 15-min breaks every hour. - 29.4 – 31.1 °C / 85 – 88 °FSunlit labour stresses the body after 30 min.
Take 30-min breaks every hour. - 31.1 – 32.2 °C / 88 – 90 °FSunlit labour stresses the body after 20 min.
Take 40-min breaks every hour. - > 32.2 °C / > 90 °FSunlit labour stresses the body after 15 min.
Take 45-min breaks every hour.
Thresholds are round Fahrenheit numbers (80, 85, 88, 90 °F) from the U.S. NIOSH 1986 standard for occupational heat exposure, expressed in Celsius. Source: Kong & Huber 2025, Sci. Data 12:246.
Panel 2 · Seasonal pulse
The year breathes
The year breathes. As Earth tilts, the moist subtropical belt slides north into boreal summer and retreats south by December — one of the great planetary rhythms, made tactile here. Each map shows the mean wet-bulb globe temperature of a reference month. Set A to June and B to December, then drag the divider across: you'll watch the Sahel, the Arabian Peninsula, and South Asia ignite, then cool as the heat slides back across the equator. The March/September pair shows the same swing from one equinox to the other.
Monthly mean wet-bulb globe temperature (°C) · NIOSH thresholds
Panel 3 · Exposure
How many hours each year cross the line?
A year is 8 760 hours. For each NIOSH threshold, the map counts how many of those hours an average grid cell spends at or above the limit — from a single dangerous afternoon to a continuous, year-round exposure.
The colour scale is logarithmic: each step is roughly ten times the hours of the one before, not twice. A red cell is not a little more dangerous than an orange one; it is an order of magnitude more.
Start the slider at the 80 °F threshold and half the inhabited tropics light up. Drag it to 88 °F. Only the Persian Gulf, the lower Indus, the Sahel, and the southern Red Sea coast remain — the places already past the line for outdoor labour in the hottest weeks.
Hours per year above the threshold
Annual hours that wet-bulb globe temperature stays at or above the chosen NIOSH limit. Log scale.
- ≈ 1 hourA single dangerous afternoon a year.
- ≈ 10 hoursA handful of episodes each summer.
- ≈ 100 hoursRoughly four days per year above the limit.
- ≈ 1 000 hoursSix weeks of dangerous heat each year.
- ≈ 8 760 hoursContinuous — every hour of every day.
Anchors at 1, 10, 100, 1 000 hours/year and the year-length cap (8 760 h) on a warm-half NIOSH palette. Source: Kong & Huber 2025, Sci. Data 12:246.
Panel 4 · Tomorrow
The same map, at four levels of warming
This is the panel where the present meets the future. The same metric as Panel 1 — the peak-month 95th-percentile WBGT — recomputed for today (about +1.1 °C above pre-industrial) and for a 15-model CMIP6 ensemble at three warming benchmarks: +1.5 °C (the Paris Agreement aspiration), +2 °C (its outer ceiling), and +3 °C (roughly where current policies put the world by 2100).
Step the slider from today through each warming level. Watch the deepest band swell outward from the Persian Gulf until it swallows the Indus, the Sahel, the lower Amazon, and the Mediterranean rim. Each additional half-degree is hundreds of millions of new people inside the extreme zone every summer.
Peak-month 95th-percentile WBGT (°C) · same NIOSH scale at every warming level
The present-day baseline uses ERA5 reanalysis at roughly +1.1 °C above pre-industrial; the warmer frames are the unweighted mean of 15 effective CMIP6 models (Kong & Huber's pre-processed ensemble, with the three EC-Earth3 realizations averaged before the cross-model mean). They are bias-corrected to the historical reanalysis so that today and tomorrow are drawn on the same scale.
Panel 5 · Eight basins, three futures
Regional zooms
A global colour ramp flattens eight separately important regions into one frame. Up close, each tells its own story: who works outside, what is being grown, which past heatwave is the historical anchor. For every region, three frames — today, +2 °C, +3 °C — let you read across the future as a single sequence. Two reference cities are pinned on every tile so the geography is never abstract.
Peak-month 95th-percentile WBGT (°C)
Same NIOSH scale across regions and warming levels
-
Sahel
A 5 000-kilometre arc of rain-fed farms and grazing land that already runs through the world’s worst heat. Sorghum and millet are planted in the hottest months — every additional half-degree shortens the window in which fieldwork is safe at all.
Niamey KhartoumToday (~+1.1 °C) Niamey Khartoum+2 °C world Niamey Khartoum+3 °C world -
Indus Valley
The Karachi heatwave of June 2015 killed more than a thousand people in days. Jacobabad, upstream on the Indus, has repeatedly recorded summer wet-bulb temperatures within striking distance of the survival limit. Brick kilns and wheat harvests continue through the peak.
Karachi LahoreToday (~+1.1 °C) Karachi Lahore+2 °C world Karachi Lahore+3 °C world -
North China Plain
The world’s largest contiguous irrigated farmland sits on China’s eastern coast. Humidity from rice paddies and a continent’s worth of summer transpiration compounds the air; the 2022 heatwave broke June temperature records across a dozen provinces.
Beijing ShanghaiToday (~+1.1 °C) Beijing Shanghai+2 °C world Beijing Shanghai+3 °C world -
Amazon
The 2023–24 Amazon drought pushed Manaus to its lowest river levels since records began and left smallholders, rubber tappers, and boatmen working through an unprecedented combination of heat and humidity. The basin’s thermostat — the forest’s own transpiration — is fraying.
Manaus BelémToday (~+1.1 °C) Manaus Belém+2 °C world Manaus Belém+3 °C world -
Indonesia
The archipelago sees no winter break: wet-bulb globe temperatures sit near the danger line every month of the year. Palm-oil tappers, rice farmers, and fishermen across the islands are among the most chronically exposed labour forces on Earth.
Jakarta SurabayaToday (~+1.1 °C) Jakarta Surabaya+2 °C world Jakarta Surabaya+3 °C world -
Northern Australia
The pre-monsoon “build-up” — the weeks before the wet season breaks — is the most dangerous stretch for miners, ranchers, and remote Indigenous communities across the north. Climate models project the build-up will lengthen as warming progresses.
Darwin Mount IsaToday (~+1.1 °C) Darwin Mount Isa+2 °C world Darwin Mount Isa+3 °C world -
Southeastern United States
Tomato pickers in Florida, sugarcane cutters in Louisiana, and construction crews across Texas already work in conditions that meet the U.S. NIOSH "high risk" threshold for weeks each summer. Federal heat-protection rules have been proposed but not enacted.
Houston MiamiToday (~+1.1 °C) Houston Miami+2 °C world Houston Miami+3 °C world -
Western Europe
The 2003 European heatwave caused roughly 70 000 excess deaths across the continent — most over a single fortnight, most in cities never built for that kind of air. Two decades later, the Mediterranean rim now routinely posts the conditions of that fortnight every summer.
Madrid RomeToday (~+1.1 °C) Madrid Rome+2 °C world Madrid Rome+3 °C world
Regional crops are taken on the client from the same equirectangular peak-month 95th-percentile WBGT textures used in Panel 4 (today, +2 °C, +3 °C). Bounding boxes follow Kong & Huber 2025, Figure 5. The +1.5 °C frame is omitted from this panel to keep the three-step sequence readable; it is available on the global comparator in Panel 4.
Panel 6 · Who lives there
Person-hours of heat stress
A map of heat alone is not a map of harm: many of the hottest cells are empty desert, many of the most populated merely uncomfortable. Multiply LandScan 2024 population by the hours each cell spends above a NIOSH threshold and you get person-hours of heat stress per year — the units in which exposure actually accumulates against Bangkok, Karachi, Dhaka, Lagos, Kolkata, Jakarta.
Read the histograms above and to the right of the map, not just the map. They sum the same metric by longitude and by latitude, and together they show a single thing: the world's heat-stress burden stacks in a narrow band that runs from the Sahel through the Indo-Gangetic plain into Southeast Asia.
The colour scale is logarithmic — adjacent cells that look similar can be a thousandfold apart. Drag the slider from 80 °F up to 90 °F and watch the burden collapse onto a handful of dense, vulnerable megaregions.
Person-hours of heat stress per year
How much human time is spent each year above the chosen NIOSH limit. Population × hours-above, on a log scale.
- ≈ 10³ person-hoursA few hundred people briefly exposed.
- ≈ 10⁵ person-hoursA small town across a hot week.
- ≈ 10⁷ person-hoursA mid-sized city across its hottest weeks.
- ≈ 10⁹ person-hoursA megaregion across a long, hot season.
- ≈ 10¹¹ person-hoursA megacity exposed year-round.
Per-cell quantity is population × annual hours above threshold; log-space smoothing keeps urban peaks intact. Population: LandScan Global 2024, ORNL. WBGT: Kong & Huber 2025.
Per-cell quantity is population × annual hours above threshold; smoothing is applied in log space so urban peaks (Bangkok, Karachi, Lagos) survive the filter. Marginal bars sum the same metric along the orthogonal axis. Population: LandScan Global 2024, Oak Ridge National Laboratory.
What this atlas can’t yet show
The night, and what comes next
Every map above is a daytime story — the hottest hours, under sun, when the body is already working hardest. But heat does its quietest damage after dark, when a hot night denies the body the recovery it needs. And these maps are snapshots and forecasts: they don’t show how far hazardous heat has already spread. A 2026 global analysis fills in both blind spots.
Trend in the ten hottest feels-like days and nights of each year, 1970s → today, global average. Universal Thermal Climate Index (UTCI). Emerton et al. 2026.
Nights are warming faster. The ten hottest nights of the year are rising at +0.32 °C per decade against +0.27 °C for the hottest days. Tropical nights — when the temperature never falls below 20 °C — are multiplying, and the compound events that pair a scorching day with a sleepless night have grown more frequent and longer-lasting on every continent.
The footprint is spreading. Regions that recorded essentially no dangerous-heat days in the 1970s now do. Heat stress is surfacing where there is no cultural or physical defence for it, even as it deepens where it was already common.
A billion more people are exposed. The share of humanity facing at least 90 days a year of strong heat stress has climbed from 55 % to 70 % since the 1970s; those hit by at least one day of extreme heat rose from 16 % to 22 % — roughly one billion additional people, driven by intensifying heat on top of population growth.
A note on the index: these figures use UTCI, not WBGT. What is it, and why a second measure?
WBGT — the index mapped everywhere above — is an empirical instrument reading (70 % wet wick, 20 % black globe, 10 % dry bulb) built for outdoor work in direct sun, with thresholds set by labour-safety bodies such as NIOSH. The 2026 study instead uses the Universal Thermal Climate Index (UTCI): an “equivalent temperature”, also in °C, derived from a model of the human body’s own thermoregulation — sweat, skin blood flow, core temperature — as it responds to air temperature, humidity, wind and radiation.
Why it matters for human health. Because UTCI tracks physiological strain rather than a fixed instrument, it carries well-defined heat-stress categories — strong (≥ 32 °C), very strong (≥ 38 °C), extreme (≥ 46 °C) — that map onto medical outcomes, and it can be computed at night, capturing the lost recovery a daytime WBGT map cannot. It is the index behind Europe’s heat-health early-warning systems.
Why we keep them apart. WBGT and UTCI answer different questions and are calibrated differently — their °C values are not interchangeable. So nothing here restates the night findings as WBGT numbers; they sit alongside the atlas as a complementary, equally physical view of the same warming world.
Source & data. Emerton, R., Nicolas, J., Lombardi, A. & Di Napoli, C. (2026). Global heat stress intensification and its expanding footprint on the human population. Nature Climate Change. doi:10.1038/s41558-026-02670-5. Built on the open ERA5-HEAT UTCI reanalysis (1940–present, Di Napoli et al.) via the Copernicus Climate Data Store — explorable through Thermal Trace — with population from the hybrid gridded demographic dataset (Chambers 2020). Paper open access under CC BY 4.0.
Methods & sources
How these maps were made
What WBGT actually measures
A wet-bulb globe thermometer is three thermometers in one: a regular bulb (dry-bulb air temperature), a bulb wrapped in a wet wick (sensitive to humidity and wind), and a bulb inside a hollow black sphere (sensitive to direct and reflected sunlight). The standard combination — 70 % wet, 20 % globe, 10 % dry — was published by Yaglou and Minard in 1957 from their U.S. Marine Corps field study to explain the heat collapses they were seeing on the parade ground. NIOSH adopted it for civilian occupational exposure in 1972 and tightened the recommended limits in 1986; ISO 7243 and most national labour codes use the same formula today.
The Liljegren method (the gold standard)
Most published heat-stress maps use an approximation (Stull, ABM) because the full physical calculation needs hourly inputs and an iterative solver for the wet wick and the black globe. Kong & Huber ran the proper Liljegren et al. 2008 calculation on hourly ERA5 reanalysis at 0.25° resolution for 1994–2023, then again on a bias-corrected CMIP6 ensemble at +1.5, +2, and +3 °C. The result is the largest physically faithful WBGT dataset to date — roughly 57 TB of raw output, distilled here into a few headline maps.
Warming levels, not calendar years
The future frames are labelled by global mean warming — +1.5, +2, +3 °C above pre-industrial — rather than by year, because the actual year a given level is reached depends on the emissions pathway. On current policies the world is heading for roughly +2.7 °C by 2100; under the 2015 Paris Agreement the goal is to hold warming "well below 2 °C" and pursue 1.5 °C. The +3 °C frame here is therefore the world we are tracking toward absent stronger action.
What the maps don't show
The dataset is a regional climate signal at 25-kilometre cells. It does not include urban heat-island effects: the streets and roofs of a tropical megacity can run several degrees warmer than the surrounding 25 km cell. Indoor conditions, air conditioning, and access to shade, drinking water, and rest are not modelled either — and they are precisely the margins on which working populations survive a hot afternoon. The maps therefore set a floor on heat stress, not a ceiling.
With gratitude
These maps would not exist without the generosity of Qinqin Kong (Postdoctoral Scholar, Stanford University), who kindly shared the pre-aggregated rasters from the Kong & Huber 2025 dataset directly with GLOBAÏA. The full computation behind these maps — the Liljegren wet-bulb-globe model run on hourly ERA5 reanalysis and a bias-corrected CMIP6 ensemble — is a years-long body of work, and we are deeply grateful for the time and care taken to prepare a clean public-facing subset for this page.
Citation
Kong, Q. & Huber, M. (2025). A global high-resolution and bias-corrected dataset of CMIP6 projected heat stress metrics. Scientific Data 12:246. doi:10.1038/s41597-025-04527-6.
Lebakula, V. et al. (2025). LandScan Global 2024. Oak Ridge National Laboratory. doi:10.48690/1532445.
Maps prepared by GLOBAÏA from the authors' pre-aggregated rasters. Natural Earth projection (Tom Patterson). Land mask: Natural Earth 1:50m. Map smoothing: σ = 0.7 grid pixels with longitude wrap. Antarctica excluded south of 60° S for visual clarity.
Suggested citation
GLOBAÏA (2026). Wet-Bulb Globe Temperature: Where humans can still work outdoors [interactive visualization]. globaia.org/wbgt/. Accessed .