Interactive Atlas
Biocultural Diversity
Where the world's languages and plants are richest — and where they overlap
Two diversities co-vary in space — and disappear together. About 70% of the world's languages live inside biodiversity hotspots that cover roughly 24% of the land (Gorenflo et al., 2012). The places that shelter the most unique plant lineages are, again and again, the same places that shelter the deepest reservoirs of linguistic heritage. This map renders both at the native grain of the source data — no aggregation, no smoothing.
Each of the 8,304 Glottolog points is drawn live as a small luminous splat (so isolated languages stay visible at any zoom and clusters accumulate into density gradients). Plant weighted endemism comes from Daru 2024 (PNAS, Dryad CC0), aggregated from species-level range maps for 201,681 native vascular plants at 20 km grain. Switch to the Richness mode for total species count; climate heterogeneity, the underlying driver, surfaces in the tooltip as context. Hover any point on land to see the overlap.
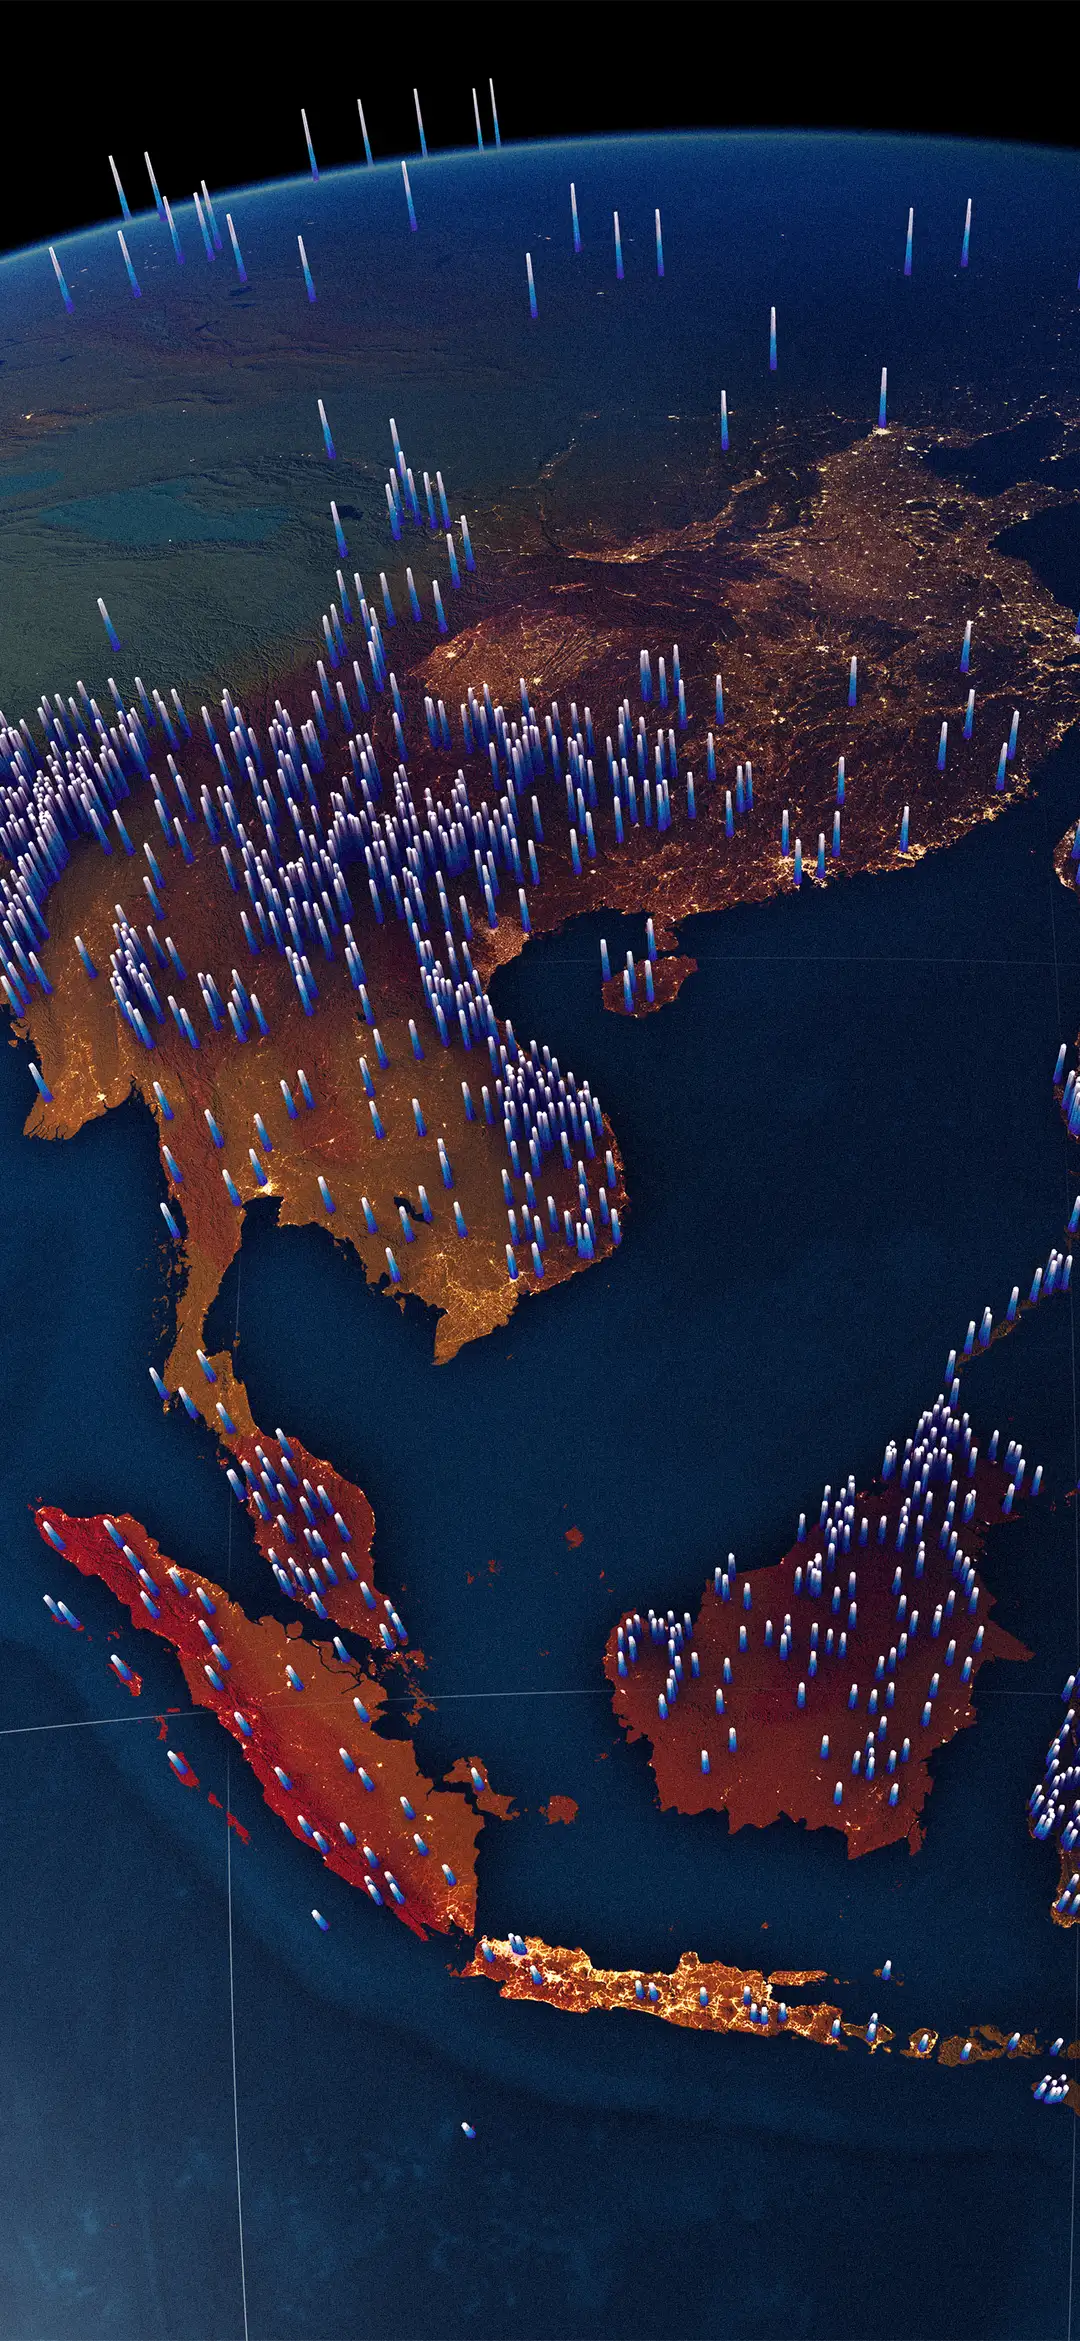
An interactive WebGL map of where the world's languages and plant diversity overlap — tap to explore it.
Interactive map · loads ~2 MB on mobile
Biocultural Diversity languages × plants
Context & insights
The empirical overlap
Gorenflo and colleagues (2012) showed that the world's biodiversity hotspots and high-biodiversity wilderness areas together cover roughly a quarter of the planet's land surface and harbour about 70% of all human languages — some 4,800 of the ~6,900 spoken at the time. Within the hotspot subset alone, 3,202 indigenous languages are spoken, 1,553 of them by 10,000 people or fewer; many qualify as endangered by population size. The pattern is not statistical accident: linguistic and biological diversity correlate with the same underlying drivers of climate heterogeneity, terrain ruggedness, and historical isolation. Mountains and islands are the planet's twin engines of speciation, both biological and cultural.
What a "hotspot" actually is
Myers and colleagues introduced the modern hotspot concept in 2000, with two strict criteria: a region must contain at least 1,500 endemic vascular plant species (≥0.5% of the world total) and have lost at least 70% of its primary vegetation. Twenty-five hotspots qualified initially; the 2004 revision (Mittermeier et al.) and subsequent work brought the list to thirty-six, the most recent addition being the North American Coastal Plain (Noss et al. 2015), recognised only when fire-suppression-aware mapping showed the longleaf-pine and pitcher-plant ecosystems were as endemism-rich and as fragmented as any tropical hotspot. Marchese (2015) catalogued more than a dozen parallel "hotspot" definitions in active use across conservation science — a useful shortcut, but not a single objective category.
Twin extinctions
Sutherland (2003), comparing IUCN red-list patterns with linguistic-vitality scores, found that languages and species face statistically indistinguishable extinction rates. Amano and colleagues (2014) refined the analysis: the strongest predictor of language-extinction risk is the same as for many vertebrates — small population size in a rapidly changing physical and economic environment. Roughly 25% of the world's languages are spoken by communities of fewer than 1,000 people, and most of those communities live inside the very hotspots highlighted on this map. Loh and Harmon (2014) integrated these signals into a global Index of Biocultural Diversity that tracks the dual loss explicitly.
Why this matters for stewardship
Maffi (2005) framed biocultural diversity not as a metaphor but as a single interlinked phenomenon: the languages, knowledge systems and ecological practices of long-resident peoples are themselves part of the diversity that conservation seeks to protect, and are often the first to vanish when an ecosystem fragments. Garnett and colleagues (2018) estimate that at least 25% of the global land surface is owned, managed or used by Indigenous peoples, and that these lands overlap disproportionately with intact ecosystems and biodiversity hotspots. Conservation frameworks that protect ecosystems without supporting the cultural and linguistic communities that have co-evolved with them tend to fail on both fronts. The hotspot concept, for all its definitional looseness, remains useful precisely because it makes the spatial coincidence visible — and the case for joint stewardship harder to ignore.
References
Primary literature behind the map's data, design and analysis.
Biocultural diversity — concept and analysis
- Gorenflo, L. J., Romaine, S., Mittermeier, R. A., & Walker-Painemilla, K. (2012). Co-occurrence of linguistic and biological diversity in biodiversity hotspots and high biodiversity wilderness areas. PNAS, 109(21), 8032–8037. https://doi.org/10.1073/pnas.1117511109.
- Maffi, L. (2005). Linguistic, cultural, and biological diversity. Annual Review of Anthropology, 34, 599–617.
- Loh, J., & Harmon, D. (2014). Biocultural diversity: threatened species, endangered languages. WWF Netherlands.
- Romaine, S., & Gorenflo, L. J. (2014). Spatial congruence in language and species richness but not threat in the world's top linguistic hotspot (Papua New Guinea). Proceedings of the Royal Society B.
- Sutherland, W. J. (2003). Parallel extinction risk and global distribution of languages and species. Nature, 423, 276–279.
- Amano, T., Sandel, B., Eager, H., Bulteau, E., Svenning, J.-C., Dalsgaard, B., Rahbek, C., Davies, R. G., & Sutherland, W. J. (2014). Global distribution and drivers of language extinction risk. Proceedings of the Royal Society B, 281, 20141574.
- Garnett, S. T., et al. (2018). A spatial overview of the global importance of Indigenous lands for conservation. Nature Sustainability, 1, 369–374.
Biodiversity hotspots — definition and revisions
- Myers, N., Mittermeier, R. A., Mittermeier, C. G., da Fonseca, G. A. B., & Kent, J. (2000). Biodiversity hotspots for conservation priorities. Nature, 403, 853–858. https://doi.org/10.1038/35002501. Source for the per-hotspot endemism counts in the hotspot tooltip.
- Mittermeier, R. A., Robles Gil, P., Hoffmann, M., Pilgrim, J., Brooks, T., Mittermeier, C. G., Lamoreux, J., & da Fonseca, G. A. B. (2004). Hotspots Revisited: Earth's Biologically Richest and Most Endangered Terrestrial Ecoregions. CEMEX, Mexico City.
- Mittermeier, R. A., Turner, W. R., Larsen, F. W., Brooks, T. M., & Gascon, C. (2011). Global biodiversity conservation: The critical role of hotspots. In F. E. Zachos & J. C. Habel (Eds.), Biodiversity Hotspots (pp. 3–22). Springer.
- Noss, R. F., Platt, W. J., Sorrie, B. A., Weakley, A. S., Means, D. B., Costanza, J., & Peet, R. K. (2015). How global biodiversity hotspots may go unrecognized: lessons from the North American Coastal Plain. Diversity and Distributions, 21, 236–244.
- Marchese, C. (2015). Biodiversity hotspots: A shortcut for a more complicated concept. Global Ecology and Conservation, 3, 297–309. https://doi.org/10.1016/j.gecco.2014.12.008.
- Critical Ecosystem Partnership Fund. Biodiversity Hotspots. https://www.cepf.net/our-work/biodiversity-hotspots.
Map data sources
- Daru, B. H. (2024). Predicting undetected native vascular plant diversity at a global scale. PNAS, 121(34), e2319989121. https://doi.org/10.1073/pnas.2319989121 · Dataset: Dryad CC0. Plant weighted endemism and species richness rasters.
- Hammarström, H., Forkel, R., Haspelmath, M., & Bank, S. (2026). Glottolog 5.3. Leipzig: Max Planck Institute for Evolutionary Anthropology. https://doi.org/10.5281/zenodo.18840935 · CC BY 4.0. 8,304 language coordinates.
- Wang, Y., et al. (2026). Mapping the world's climate diversity. Conservation Letters. Climate-heterogeneity context layer in the area tooltip.
Cartographic technique
- Brewer, C. A. (1994). Color use guidelines for mapping and visualization. In A. M. MacEachren & D. R. F. Taylor (Eds.), Visualization in Modern Cartography. Pergamon. Foundation of bivariate choropleth design.
- Stevens, J. (2015). Bivariate Choropleth Maps: A How-to Guide. joshuastevens.net. Modern reference for the four-corner palette construction used here.
- Björn, O. (2020). A perceptual color space for image processing — OKLab. Perceptually uniform colour space used for the bilinear interpolation.
- Mikhailov, A. (2019). Turbo, an improved rainbow colormap for visualization. Google AI Blog. Default single-axis colormap.