Euclid Flagship 2 · a mock universe
A Universe Built for a Telescope
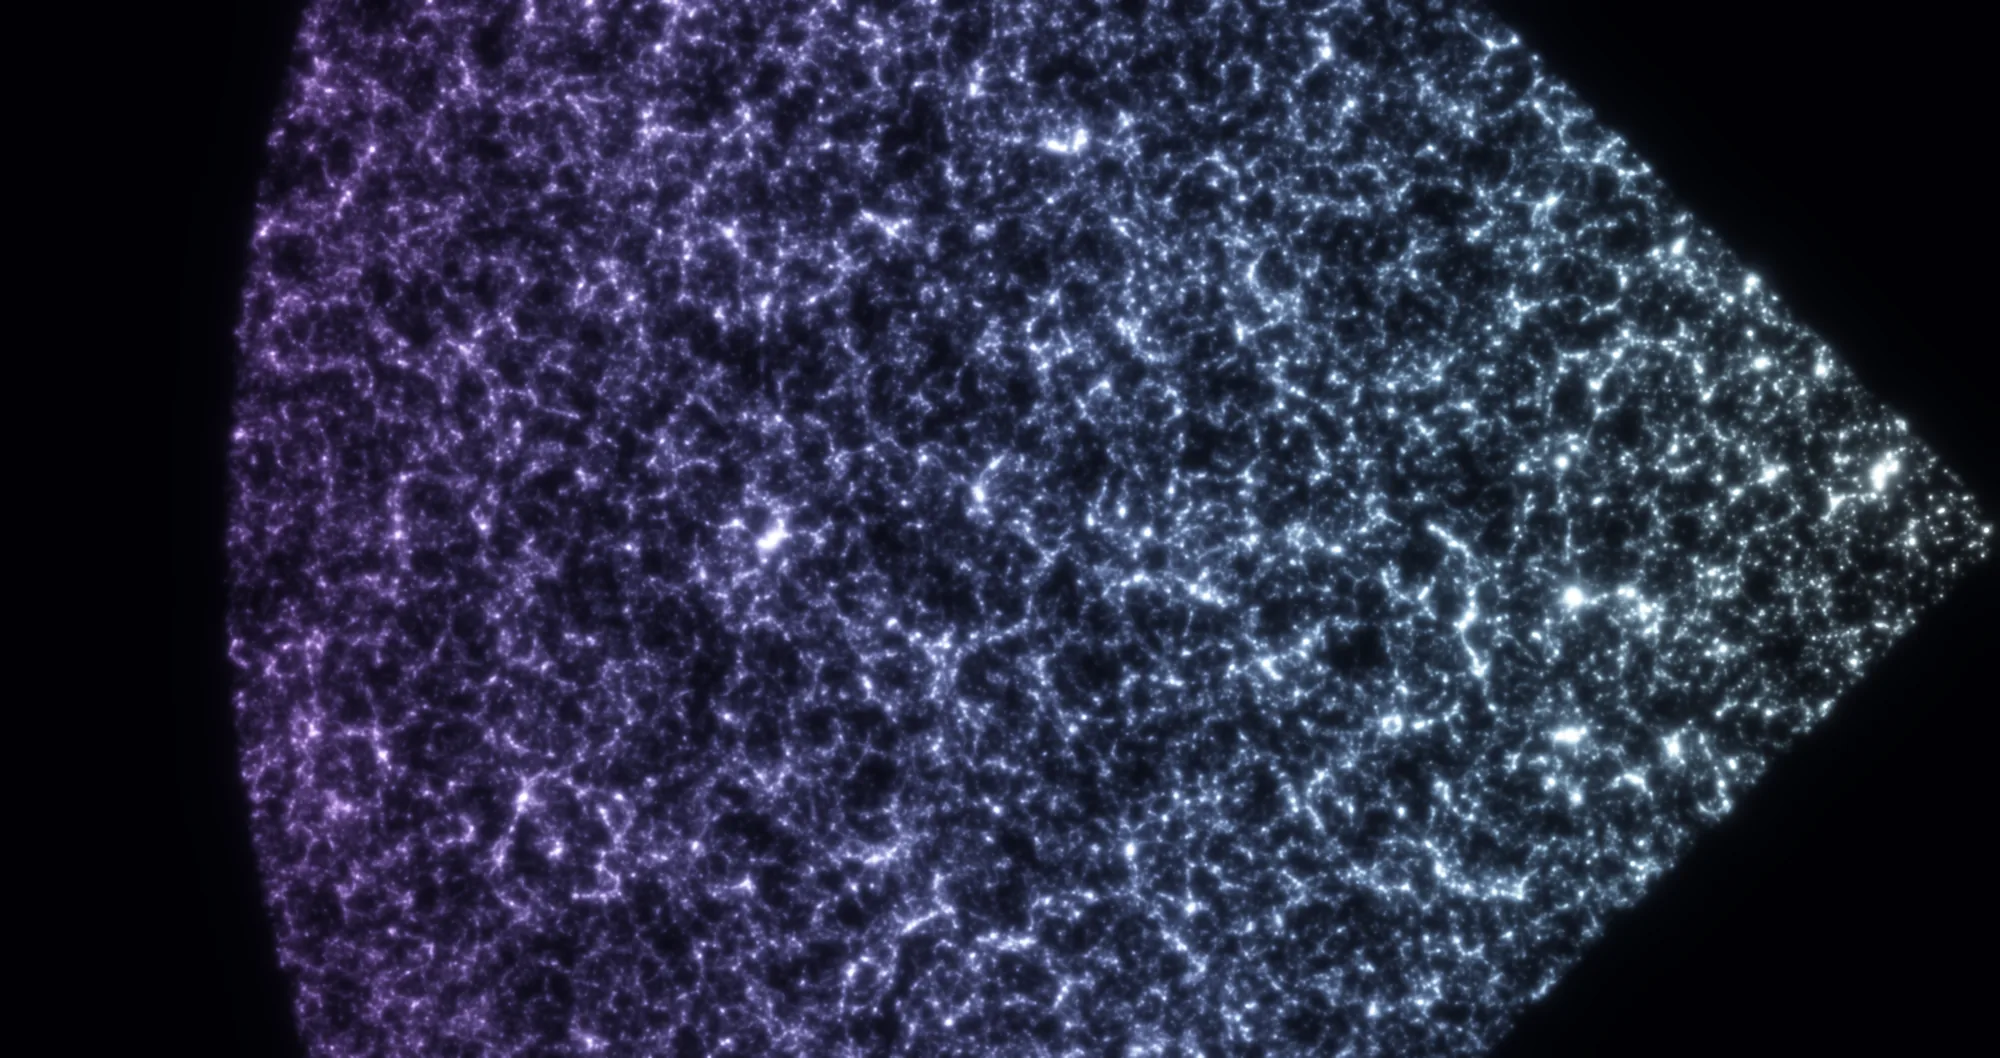
Before a telescope looks, its makers rehearse. Euclid, the European space telescope mapping a third of the sky, was given a universe of its own to practise on: four trillion particles of dark matter, grown from the early Universe, then dressed, across an eighth of the sky, with 3.4 billion galaxies, each with a colour, a brightness and a shape. Every one of them is placed as a telescope would receive it, older the farther it lies.
The lightcone wedge
Loading 783,805 galaxies
Inside one cluster
How to Read the Fan
Two clocks on each arc. The number on one end of an arc says when the light we would see left that distance; the number on the other end says how far that place is today, after all the expansion that happened while the light was on its way. The rim of the fan is 21.3 billion light-years away now, though its light has travelled for only 11.7 billion years. Hover or tap anywhere in the fan to read both.
A slice that thickens. The fan is 90° of sky wide and half a degree deep, flattened onto the page. Half a degree is a sliver nearby and a slab far away: 12 million light-years thick 1.4 billion years back, 186 million at the rim. Far galaxies come from a deeper slice, which is why the outer fan looks crowded even though fewer of its galaxies are bright enough to list.
One galaxy in 32. Each dot is one galaxy of the simulation, drawn from a random sample: 783,805 of the roughly 25 million that Flagship 2 places in this slice. The full mock lists every galaxy brighter than magnitude 26 in near-infrared light; anything fainter is not in it.
True or measured. “True” places each galaxy where the simulation put it. “As measured” uses the redshift a telescope would record, motion included. Both use the simulation's own cosmology, with matter making up 31.9% of the Universe's energy today.
Deep field · every galaxy in one patch of sky
Small Sky, Deep Time
The same simulated universe, now seen as a camera would see it. A patch of sky 59% the size of the full Moon, and in it every galaxy Flagship 2 lists down to its faint limit: 81,980 of them, each painted from its own numbers. Half of them sent their light more than 9.3 billion years ago; 92 in a hundred, before the Sun was born.
Painting 81,980 galaxies
How Deep Is This
Less than a Moon of sky. The patch is 15′ by 30′, 0.124 square degrees: 59% of the full Moon's disc, and its long side nearly the Moon's width of 31′. In it lie 81,980 galaxies of the simulation. At that density the whole sky would hold some 27 billion galaxies above the mock's faint limit, and 11,561 of the ones here, 14%, are bright enough for Euclid's wide survey. The farthest of those sent its light 11.7 billion years ago.
Painted, not photographed. Each galaxy is drawn from what the mock gives it: a flat disc whose light fades outward, a rounder central bulge, each with its own half-light radius, flattening and share of the light, turned at its own angle. There is no noise, no star of our own Galaxy, no blur of a telescope. This is what the simulation says is there, before any camera adds its own marks.
Colour from four real bands. Euclid sees in one visible band, VIS, and three near-infrared ones, Y, J and H. Here H is red, Y and J together green, VIS blue, balanced so that the light of the whole patch, added up, is white. Brightness follows the asinh stretch of Lupton and colleagues (2004), which keeps a galaxy's colour while taming its glare. Redder means more near-infrared light: old stars, dust, or light stretched by its long journey.
Bent on the way. Every ray crossed the dark matter between its galaxy and us, and was deflected. With lensing on, each galaxy sits where its light appears, sheared and magnified or dimmed; off, where it really is. The whole patch moves by about 95″, which no telescope could notice, so that common shift is removed; what remains moves galaxies 15″ on median and up to 96″, and makes the most magnified one 2.0 times brighter. The change of shape is a few percent, invisible in one galaxy, and exactly what Euclid measures across millions.
Turned on its side. The patch is the mouth of a pencil beam. Side view slides every galaxy from its place on the sky to its place along the beam: distance from us across the stage, its light-travel time on the ticks. The beam runs 21.3 billion light-years, as the Universe stands today, and is 186 million light-years wide at its far end: 115 times longer than wide. Drawn true, it is a hair; stretched sideways, the stated number of times, its galaxies come apart, and each painted speck of the sky view finds its own depth.
Disc and bulge are drawn as the Gaussian mixtures of Hogg and Lang (2013), exponential and de Vaucouleurs; the mock gives each bulge its own Sérsic index, which this extract did not include. Orientations are the mock's image-simulation angles; its separate intrinsic-alignment shapes are not used here.
Weak lensing · light that left 8 billion years ago
Mass Without Light
Nothing on this map shines. Each glow is the trace of mass standing between us and a shell of the simulation's galaxies, 3.3 million of them, whose light set out 8.0 billion years ago, when the Universe was 5.8 billion years old. On the way here that light was bent, a little, by everything it passed. Most of what bent it is dark matter.
Loading the lens map
Light Bent, Dark Weighed
A long way round. Light does not travel straight through a lumpy universe. Every clump it grazes pulls it slightly off course, as glass bends light in a lens. A distant galaxy seen through such clumps looks a little larger and a little stretched, sideways to the mass in front. The figure exaggerates it; the true effect here is about one percent.
Glow for the enlargement. The brightness is the convergence, κ, how strongly the mass in front magnifies the galaxies behind. The simulation computes it for each of its galaxies, from its own maps of the mass; here it is averaged over all those in each 3-arcminute cell. The emptiness wins by area: most of the sky looks through voids, and the mass gathers in a web of knots and threads.
Whiskers for the stretch. Each line is the mean shear, γ, over a block of cells: its length the strength, its angle the axis along which images are drawn out. Around a heavy knot the whiskers wrap round it, as rings round a stone. They point at nothing; they encircle.
Weighing the invisible. Euclid cannot see dark matter. It measures the shapes of more than a billion galaxies instead, and since no real galaxy is round, a stretch of one percent hides under each galaxy's own shape. Only the average of many shows it. The simulation, free of that noise, gives the map Euclid's averaging is built to recover.
Peaks, not clusters. A peak here is a local high point of the glow, three standard deviations above the map's mean. It may be one massive cluster, or several lighter ones lined up along our sight; the map alone cannot tell them apart.
A patch of 335 full Moons. The map covers 70.6 square degrees. The mass that bends this light most efficiently lies about 58% of the way out, near redshift 0.5, 5.3 billion years back; there, one degree spans 113 million light-years of today's space. The scale bar assumes that distance, the simulation's cosmology, and matter at 31.9% of the Universe's energy today.
Side view. Along the line, the mass sits where lensing is most efficient for this shell, 58% of the way out; the bend and the shapes are exaggerated.
North is up and east to the left, as the sky looks from below. Whisker angles use CosmoHub's shear components read with west as the first axis. We checked this against the map itself: rebuilt from the whiskers alone, the glow returns with a correlation of 0.93, and around the heaviest cells the stretch runs round them, not toward them.
One eighth of the sky, cut open
Shell by Shell, Age by Age
Every telescope sits at the heart of an onion. Look out and each layer of sky is older than the one inside it, down to the last layer of all, the glow left by the young Universe 13.8 billion years ago. Flagship 2 fills one wedge of that onion with 3.3 billion galaxies, out to light 11.7 billion years old. Here is the wedge inside the whole, cut open like a fruit: the skin is the sky, the flesh is time, and at the core, where every line of sight begins, are we.
Waiting to open
Scale
Radius is the light's travel time: the wedge's rim 11.7 billion years, the sphere 13.8.
The glass sphere: Planck's map of the oldest light, violet where it is a touch colder, pale cyan where a touch warmer, by up to 235 millionths of a degree
The cut and the flat faces: galaxies coloured by when their light left, cyan for near, blue for 11.7 billion years ago
One eighth, never more. The simulation's galaxies fill the sky between right ascension 145° and 235°, from the celestial equator to the pole: 5,157 square degrees, one eighth of the whole sky. That eighth is drawn as it is, never mirrored to fill the rest, and only its part below the cut is shown, so the cut lies open. Its farthest light left 11.7 billion years ago, most of the way back to the beginning; yet its far rim now lies 21.3 billion light-years away, less than half way to the edge of the sphere. The scale switch shows both readings.
The edge of what we can see. The glass sphere is the whole observable Universe, at the same scale as the wedge. Its light left 13.8 billion years ago, when the Universe was 373 thousand years old and first let light through; the place it left now lies 45.3 billion light-years away. Both numbers come from the simulation's own cosmology, radiation included. Its skin is the real sky there, the cosmic microwave background as mapped by the Planck satellite, smoothed to half a degree. It is not part of Flagship 2.
Twelve skins. Each skin gathers the galaxies of one shell, a quarter of a unit of redshift deep. Time is not shared out evenly: the nearest skin holds 3.1 billion years, the farthest only 0.2. Each skin is coloured against its own average, from its emptiest patches to its most crowded, so the pattern shows in every shell; compare shapes between skins, not brightness. The counts are smoothed over 2°, about four full Moons side by side, so the skin reads soft; hover or tap it for the raw count in one patch of 0.21 square degrees, about the size of the full Moon.
Only the bright are counted. The mock lists galaxies brighter than magnitude 26 in near-infrared light. Far away, only the brightest still pass, so the outer skins look emptier partly because the faint have dropped out of the list, not out of the Universe. Counts rise to 437 million galaxies in the shell 8.0 to 8.9 billion years back, then fall to 127 million in the last, though every shell beyond the peak holds more space than it. The share of red galaxies climbs outward, from 8% in the nearest skin to 31% in the farthest: the same sieve at work, a selection, not a history.
The cut. The cone is the half-degree slice of the fan above, at declination 30°, folded back onto its cone: 783,805 galaxies, one in 32 of those the simulation places there. The octant's three flat faces carry their own half-degree slices, sampled the same way: 286,606 galaxies on the wall at right ascension 145°, 292,597 on the wall at 235°, 899,138 on the floor along the celestial equator. Every face is ringed at every shell.
Cosmic microwave background: ESA and the Planck Collaboration, SMICA map from Planck 2015 results IX (A&A 594, A9), via IRSA.
Eleven billion years in sixty slices
Cosmic Noon, Cosmic Dusk
A cooling. Galaxies once made stars far faster than they do now. Sorted by the time their light left them, Flagship 2's 3.3 billion listed galaxies tell that story in 60 slices of time reaching 11.7 billion years back. Each chart reads one property per slice; hover or tap any of them and all eight follow the same moment.
A census of the bright, not of everyone. The mock lists only galaxies brighter than magnitude 26 in near-infrared light. Nearby, half the listed galaxies hold fewer than 23 million suns' worth of stars; at the far edge the typical listed galaxy is 89 times heavier, and the faint majority is missing. Most curves below change for two reasons at once: galaxies changed, and so did the list. They show what a survey this deep would count, not the history of every galaxy. The charts are built from a random one-in-64 sample, 51,989,833 galaxies.
Across each chart: billions of years ago, today on the right; below, the redshift z.
The Fever and the Cooling
Stars born per year, per volume of space
Flagship 2, listed galaxiesfit to real surveys (Madau and Dickinson 2014)
Every listed galaxy's star formation, added up, scaled by 64 for the sample, and divided by the volume of space it fills: a cubic megaparsec is a cube 3.26 million light-years wide. The simulation's galaxies made stars fastest between 11 and 9.6 billion years ago, the stretch astronomers call cosmic noon, and have slowed 7-fold since. Dashed: the curve fitted to real surveys by Madau and Dickinson (2014). Flagship 2 runs 1.6 to 2.1 times above it: the shapes agree better than the levels. The small steps at redshift 0.5, 1 and 1.5 are seams in the mock's recipe, not events in the sky.
The pace of growth
New stars each year divided by stars already made, for all listed galaxies together. The one-in-64 sampling cancels out of this ratio; the brightness cut does not. At today's pace the listed galaxies would need 11 billion years to double their stars. 11.7 billion years ago, 515 million.
The Census of the Bright
Of the galaxies bright enough to be listed. These six move with the brightness cut as much as with time.
Red, in between, blue
red: no longer forming starsin betweenblue: still forming stars
The red share climbs from 7% today to 31% at the far edge. That is the list changing, not the Universe: deep surveys find the share of galaxies that have stopped forming stars growing toward today, at every mass. Far away only big, bright galaxies are listed, and big galaxies redden first.
How many make the list
Listed galaxies per cube 10 megaparsecs (32.6 million light-years) wide: 220 in the nearest slice, 7 at the far edge, 32 times fewer. Space was not emptier of galaxies. The faint ones slip below the cut.
The typical listed galaxy, by mass
Half the galaxies bright enough to be listed hold more stars than this, half fewer: 23 million suns nearby, 2.0 billion at the far edge, 89 times heavier. Galaxies did not shrink as they aged. The cut rose with distance.
The typical listed galaxy, by star birth
Median star formation of the galaxies bright enough to be listed: 0.01 suns a year nearby, 7 at the far edge. Two causes pull the same way. Young galaxies were busier, and only busy ones shine enough to be seen from so far.
Satellites and centrals
The share of listed galaxies that orbit inside a bigger galaxy's halo instead of sitting at its centre: 58% nearby, 19% at the far edge. Satellites are mostly small and faint, so the far list loses them first.
Oxygen in the gas
Mean oxygen in the listed galaxies' gas, as a share of the Sun's (12 + log O/H, the Sun at 8.69): flat, between 31% and 40%. Flagship 2 computes each galaxy's oxygen from its mass, star formation and redshift, so older, poorer gas and heavier listed galaxies cancel out.
Units. Flagship 2 states stellar masses and star formation in units scaled by the Hubble constant (h⁻² solar masses, Castander et al. 2025); they are converted here with the simulation's h = 0.67. Star formation is read from each galaxy's ultraviolet light before dust, for a Chabrier mix of star masses. The survey fit of Madau and Dickinson (2014) is published for a Salpeter mix and is multiplied by 0.63 to match. Volumes are comoving shells of the mock's eighth of the sky, in the simulation's own cosmology. Each point is a slice of 0.05 in redshift, drawn at its middle; the 19 galaxies just past redshift 3, where the mock ends, are left out.
A recipe, not a growth. Flagship 2's galaxies are painted onto dark-matter haloes by rules tuned to real counts and colours; they do not evolve from one slice to the next. Each slice is a fresh census of what those rules give at that epoch.
The numbers, slice by slice
| Redshift | Billion years ago | Sample galaxies | Stars per year per Mpc³ | Survey fit | Growth per billion years | Red | In between | Blue | Per (10 Mpc)³ | Median mass, suns | Median stars per year | Satellites | 12 + log(O/H) |
|---|---|---|---|---|---|---|---|---|---|---|---|---|---|
| 0.00 to 0.05 | 0.36 | 19,433 | 0.019 | 0.010 | 9% | 7% | 12% | 81% | 220.0 | 23 million | 0.01 | 58% | 8.21 |
| 0.05 to 0.10 | 1.04 | 113,252 | 0.020 | 0.011 | 11% | 7% | 12% | 81% | 191.2 | 21 million | 0.01 | 54% | 8.19 |
| 0.10 to 0.15 | 1.67 | 303,160 | 0.023 | 0.013 | 12% | 7% | 12% | 81% | 198.1 | 21 million | 0.01 | 54% | 8.18 |
| 0.15 to 0.20 | 2.26 | 502,214 | 0.026 | 0.015 | 13% | 8% | 13% | 79% | 177.5 | 25 million | 0.02 | 54% | 8.19 |
| 0.20 to 0.25 | 2.80 | 628,811 | 0.028 | 0.016 | 13% | 9% | 14% | 77% | 142.2 | 37 million | 0.03 | 52% | 8.22 |
| 0.25 to 0.30 | 3.31 | 726,105 | 0.031 | 0.018 | 14% | 10% | 14% | 76% | 116.3 | 56 million | 0.04 | 51% | 8.25 |
| 0.30 to 0.35 | 3.79 | 774,690 | 0.033 | 0.020 | 15% | 11% | 14% | 75% | 94.1 | 78 million | 0.06 | 49% | 8.27 |
| 0.35 to 0.40 | 4.24 | 839,259 | 0.036 | 0.022 | 17% | 12% | 14% | 74% | 81.1 | 99 million | 0.09 | 48% | 8.28 |
| 0.40 to 0.45 | 4.66 | 901,336 | 0.040 | 0.024 | 19% | 13% | 14% | 73% | 71.8 | 122 million | 0.1 | 47% | 8.29 |
| 0.45 to 0.50 | 5.05 | 941,053 | 0.042 | 0.026 | 21% | 14% | 14% | 72% | 63.6 | 147 million | 0.1 | 46% | 8.30 |
| 0.50 to 0.55 | 5.42 | 993,424 | 0.059 | 0.029 | 30% | 14% | 14% | 72% | 58.3 | 166 million | 0.2 | 45% | 8.28 |
| 0.55 to 0.60 | 5.76 | 1,041,755 | 0.062 | 0.031 | 34% | 15% | 14% | 71% | 54.0 | 177 million | 0.3 | 44% | 8.27 |
| 0.60 to 0.65 | 6.08 | 1,093,398 | 0.066 | 0.034 | 37% | 16% | 14% | 70% | 50.9 | 191 million | 0.3 | 43% | 8.27 |
| 0.65 to 0.70 | 6.39 | 1,139,564 | 0.070 | 0.036 | 39% | 16% | 15% | 69% | 48.2 | 210 million | 0.4 | 43% | 8.27 |
| 0.70 to 0.75 | 6.67 | 1,182,633 | 0.073 | 0.039 | 41% | 17% | 15% | 69% | 46.0 | 231 million | 0.4 | 42% | 8.27 |
| 0.75 to 0.80 | 6.94 | 1,223,586 | 0.077 | 0.042 | 43% | 17% | 15% | 68% | 44.2 | 252 million | 0.5 | 41% | 8.27 |
| 0.80 to 0.85 | 7.20 | 1,267,062 | 0.082 | 0.045 | 44% | 18% | 15% | 67% | 42.8 | 274 million | 0.6 | 41% | 8.27 |
| 0.85 to 0.90 | 7.44 | 1,321,875 | 0.087 | 0.047 | 46% | 19% | 15% | 67% | 42.1 | 298 million | 0.6 | 40% | 8.27 |
| 0.90 to 0.95 | 7.66 | 1,363,047 | 0.092 | 0.050 | 47% | 19% | 15% | 66% | 41.1 | 326 million | 0.7 | 40% | 8.28 |
| 0.95 to 1.00 | 7.88 | 1,390,075 | 0.096 | 0.053 | 48% | 20% | 15% | 65% | 39.9 | 354 million | 0.8 | 39% | 8.28 |
| 1.00 to 1.05 | 8.08 | 1,404,315 | 0.116 | 0.056 | 59% | 20% | 15% | 65% | 38.6 | 382 million | 0.9 | 38% | 8.28 |
| 1.05 to 1.10 | 8.27 | 1,386,063 | 0.117 | 0.059 | 65% | 21% | 15% | 64% | 36.7 | 405 million | 1 | 38% | 8.27 |
| 1.10 to 1.15 | 8.46 | 1,375,174 | 0.119 | 0.062 | 70% | 21% | 16% | 63% | 35.1 | 432 million | 1 | 37% | 8.27 |
| 1.15 to 1.20 | 8.63 | 1,340,978 | 0.118 | 0.064 | 76% | 22% | 16% | 63% | 33.2 | 458 million | 1 | 37% | 8.27 |
| 1.20 to 1.25 | 8.79 | 1,315,821 | 0.118 | 0.067 | 81% | 22% | 16% | 62% | 31.6 | 485 million | 1 | 36% | 8.27 |
| 1.25 to 1.30 | 8.95 | 1,298,859 | 0.120 | 0.069 | 86% | 22% | 16% | 62% | 30.4 | 515 million | 1 | 36% | 8.27 |
| 1.30 to 1.35 | 9.10 | 1,258,959 | 0.119 | 0.071 | 91% | 23% | 16% | 61% | 28.8 | 543 million | 1 | 35% | 8.27 |
| 1.35 to 1.40 | 9.24 | 1,220,123 | 0.118 | 0.074 | 95% | 23% | 16% | 61% | 27.3 | 575 million | 2 | 35% | 8.28 |
| 1.40 to 1.45 | 9.37 | 1,195,413 | 0.119 | 0.076 | 99% | 24% | 16% | 61% | 26.3 | 605 million | 2 | 34% | 8.28 |
| 1.45 to 1.50 | 9.50 | 1,164,952 | 0.120 | 0.077 | 104% | 24% | 16% | 60% | 25.2 | 643 million | 2 | 34% | 8.29 |
| 1.50 to 1.55 | 9.63 | 1,132,440 | 0.144 | 0.079 | 132% | 25% | 16% | 60% | 24.1 | 673 million | 2 | 33% | 8.28 |
| 1.55 to 1.60 | 9.74 | 1,106,833 | 0.144 | 0.080 | 140% | 25% | 15% | 60% | 23.2 | 700 million | 2 | 33% | 8.27 |
| 1.60 to 1.65 | 9.85 | 1,071,590 | 0.142 | 0.081 | 147% | 25% | 15% | 60% | 22.2 | 733 million | 2 | 32% | 8.27 |
| 1.65 to 1.70 | 9.96 | 1,045,537 | 0.141 | 0.082 | 152% | 25% | 15% | 59% | 21.4 | 764 million | 2 | 32% | 8.27 |
| 1.70 to 1.75 | 10.06 | 1,011,046 | 0.139 | 0.083 | 159% | 26% | 15% | 59% | 20.5 | 800 million | 3 | 31% | 8.27 |
| 1.75 to 1.80 | 10.16 | 973,014 | 0.137 | 0.083 | 165% | 26% | 15% | 59% | 19.6 | 836 million | 3 | 31% | 8.27 |
| 1.80 to 1.85 | 10.26 | 944,453 | 0.136 | 0.084 | 168% | 26% | 15% | 59% | 18.9 | 875 million | 3 | 30% | 8.27 |
| 1.85 to 1.90 | 10.35 | 913,819 | 0.134 | 0.084 | 171% | 27% | 15% | 59% | 18.1 | 920 million | 3 | 30% | 8.27 |
| 1.90 to 1.95 | 10.43 | 884,586 | 0.133 | 0.084 | 174% | 27% | 14% | 58% | 17.4 | 964 million | 3 | 30% | 8.27 |
| 1.95 to 2.00 | 10.52 | 850,935 | 0.132 | 0.083 | 177% | 28% | 14% | 58% | 16.7 | 1.0 billion | 3 | 29% | 8.28 |
| 2.00 to 2.05 | 10.60 | 812,849 | 0.143 | 0.083 | 200% | 28% | 14% | 58% | 15.9 | 1.1 billion | 3 | 29% | 8.27 |
| 2.05 to 2.10 | 10.67 | 780,183 | 0.140 | 0.082 | 203% | 28% | 14% | 58% | 15.2 | 1.1 billion | 4 | 28% | 8.27 |
| 2.10 to 2.15 | 10.75 | 747,420 | 0.136 | 0.081 | 204% | 29% | 14% | 58% | 14.5 | 1.1 billion | 4 | 28% | 8.27 |
| 2.15 to 2.20 | 10.82 | 720,165 | 0.133 | 0.080 | 207% | 29% | 14% | 58% | 13.9 | 1.1 billion | 4 | 27% | 8.26 |
| 2.20 to 2.25 | 10.89 | 695,748 | 0.131 | 0.079 | 207% | 29% | 13% | 58% | 13.4 | 1.2 billion | 4 | 27% | 8.26 |
| 2.25 to 2.30 | 10.95 | 666,143 | 0.127 | 0.078 | 206% | 29% | 13% | 58% | 12.8 | 1.2 billion | 5 | 26% | 8.26 |
| 2.30 to 2.35 | 11.01 | 638,618 | 0.123 | 0.077 | 204% | 30% | 13% | 58% | 12.3 | 1.3 billion | 5 | 26% | 8.26 |
| 2.35 to 2.40 | 11.08 | 615,161 | 0.120 | 0.076 | 202% | 30% | 13% | 58% | 11.8 | 1.3 billion | 5 | 25% | 8.26 |
| 2.40 to 2.45 | 11.14 | 594,606 | 0.118 | 0.074 | 199% | 30% | 12% | 58% | 11.5 | 1.4 billion | 5 | 25% | 8.27 |
| 2.45 to 2.50 | 11.19 | 568,673 | 0.115 | 0.073 | 195% | 30% | 12% | 58% | 11.0 | 1.4 billion | 5 | 24% | 8.27 |
| 2.50 to 2.55 | 11.25 | 545,554 | 0.119 | 0.071 | 204% | 30% | 12% | 58% | 10.5 | 1.5 billion | 5 | 24% | 8.27 |
| 2.55 to 2.60 | 11.30 | 524,808 | 0.119 | 0.070 | 208% | 31% | 12% | 58% | 10.1 | 1.5 billion | 6 | 23% | 8.27 |
| 2.60 to 2.65 | 11.35 | 498,913 | 0.116 | 0.068 | 211% | 30% | 11% | 58% | 9.6 | 1.6 billion | 6 | 23% | 8.26 |
| 2.65 to 2.70 | 11.40 | 477,839 | 0.115 | 0.067 | 213% | 31% | 11% | 58% | 9.2 | 1.6 billion | 6 | 22% | 8.26 |
| 2.70 to 2.75 | 11.45 | 455,475 | 0.113 | 0.065 | 213% | 31% | 11% | 59% | 8.8 | 1.7 billion | 7 | 22% | 8.26 |
| 2.75 to 2.80 | 11.50 | 436,874 | 0.111 | 0.063 | 210% | 31% | 10% | 59% | 8.5 | 1.7 billion | 7 | 21% | 8.26 |
| 2.80 to 2.85 | 11.54 | 418,012 | 0.110 | 0.062 | 210% | 31% | 10% | 59% | 8.1 | 1.8 billion | 7 | 20% | 8.26 |
| 2.85 to 2.90 | 11.58 | 397,437 | 0.108 | 0.060 | 205% | 31% | 10% | 59% | 7.8 | 1.9 billion | 7 | 20% | 8.27 |
| 2.90 to 2.95 | 11.63 | 380,377 | 0.108 | 0.059 | 202% | 31% | 9% | 60% | 7.5 | 2.0 billion | 7 | 19% | 8.27 |
| 2.95 to 3.00 | 11.67 | 354,336 | 0.103 | 0.057 | 194% | 31% | 9% | 60% | 7.0 | 2.0 billion | 7 | 19% | 8.27 |
Data: Flagship 2 galaxy mock, CosmoHub query 27552, one galaxy in 64. Survey fit: Madau & Dickinson (2014), ARA&A 52, 415. Solar oxygen: Asplund et al. (2009).
Made to Learn, Made with Thanks
A debt of gratitude. Everything on this page rests on years of work by others, given freely. Flagship 2 was built by the Euclid Consortium, led for this mock by Francisco Castander, Pablo Fosalba, Joachim Stadel and Douglas Potter with many colleagues, run on Piz Daint at the Swiss National Supercomputing Centre, and opened to all through CosmoHub at the Port d'Informació Científica, thanks to Pau Tallada, Jorge Carretero and their team. The oldest light in the sphere above comes from ESA and the Planck Collaboration, served by NASA's IRSA. We thank them, and the wider community of cosmologists, engineers and archivists who choose to publish their data openly, so that a universe computed for science can also be shared, looked at and wondered over by anyone.
For learning only. A Universe Built for a Telescope is a GLOBAÏA project made for educational purposes only. It is not commercial and not a scientific product: the samples here are small, quantised and drawn for the eye. For research, use the original catalogues and papers credited below, and cite their authors.