
Explore the WBGT Atlas

Pick a layer, swap the projection, recentre on any meridian, and click any pixel for its NIOSH heat-stress band. The land and water hemispheres open as a globe you can spin.
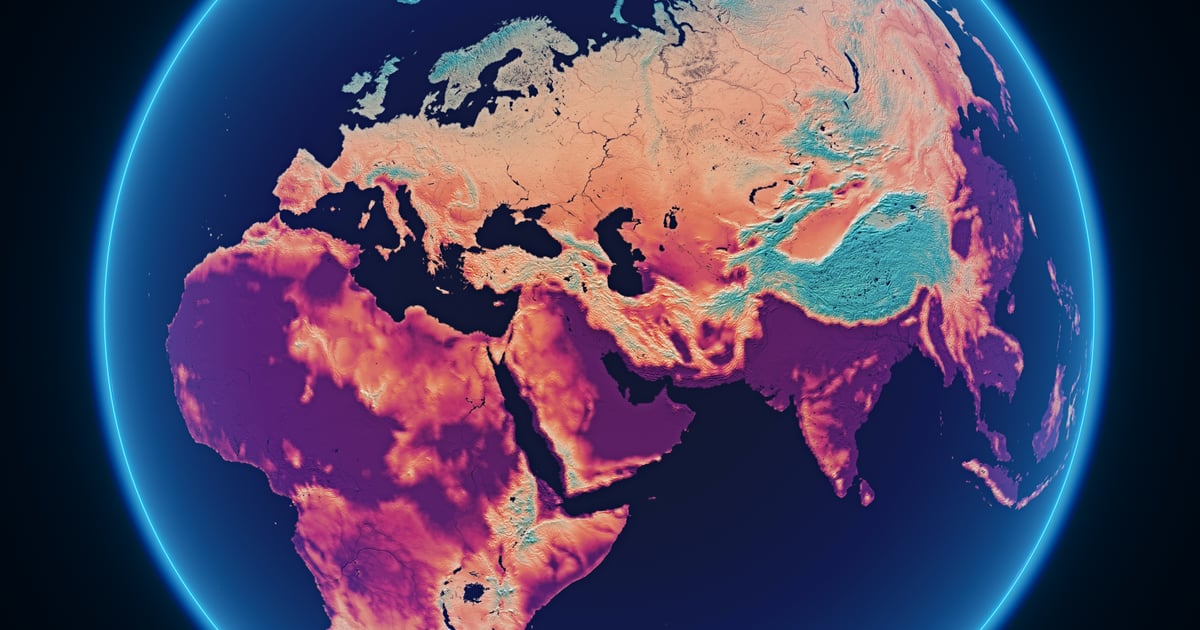
Wet-bulb globe temperature world map

An interactive world map of heat stress (WBGT): 17 climate layers, 10 projections, click any pixel for its danger band — tap to explore it.

Interactive map · loads ~0.6 MB on mobile

Layer
Centre

—

—

Click readout

Lon
—
Lat
—
Value
—

About this layer

What it shows

Why it matters

What you're seeing

With warm thanks to Qinqin Kong (Postdoctoral Scholar, Stanford University), who kindly shared the pre-aggregated WBGT rasters from Kong & Huber 2025 directly with GLOBAÏA — a years-long body of computation distilled into the textures this map reprojects.

Data: Kong & Huber (2025), Scientific Data 12:246, doi:10.1038/s41597-025-04527-6. Population: Lebakula et al. (2025), LandScan Global 2024, ORNL, doi:10.48690/1532445.