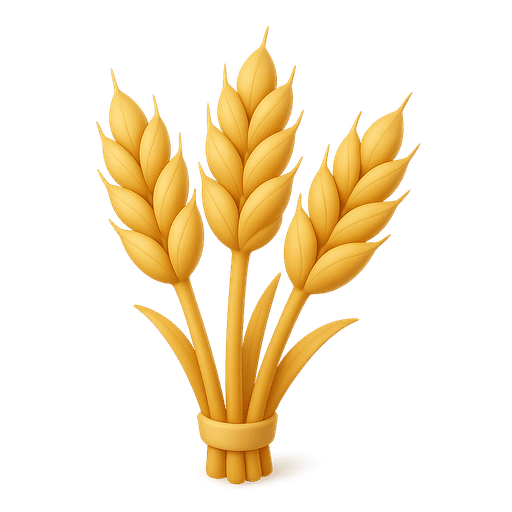
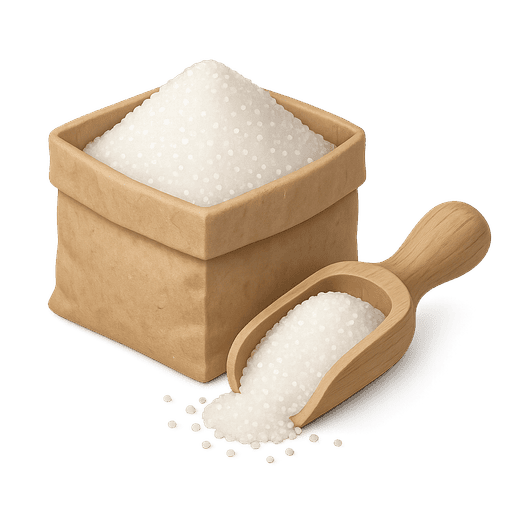
01 / 14 Whole grains
210 g/day range 0–280 g 811 kcal
In a market in Addis Ababa, a sack of teff. In Bologna, a bin of farro. In Kyoto, polished and unpolished short-grain rice. In a Bangladeshi rural home, brown rice and millets. The Commission's reference value is 210 grams a day — a number that hides all of this richness. Below, the first cluster picks out the whole ancient grains and cereals on which civilisations have built themselves; the second pulls out their fibre-rich neighbours across cuisines.
What Epicure shows
(the recipe-corpus clusters that fill this role)
Whole ancient grains and cereals cluster of 42 ingredients - quinoa
- millet
- black rice
- red rice
- brown rice
- sorghum
- glutinous rice
- glutinous rice flour
- whole wheat flour
- coix seed
- mixed grains
- wheat
- wheat germ
- barley
- amaranth
- jobs tears
- fermented glutinous rice
- tapioca
Breads, pastas and grain products cluster of 72 ingredients - bread crumbs
- pasta
- crouton
- farro
- pita bread
- bread
- polenta
- tortellini
- english muffin
- egg noodle
- pizza crust
- bagel
- muffin
- naan
- gnocchi
- wild rice
- croissant
- ravioli
Cross-cutting view
(by flavour, nutrient profile, or processing level)
Fiber-rich nuts seeds and whole grains cluster of 65 ingredients - chia seed
- hazelnut
- whole wheat flour
- pumpkin seed
- carob
- hemp seed
- chocolate
- walnut
- flaxseed
- milk chocolate
- almond butter
- almond
- cocoa powder
- pistachio
- wheat germ
- nut butter
- bran
- oat
East-Asian whole grains and fiber-rich seeds cluster of 59 ingredients - wood ear mushroom
- mung bean
- taro
- hyacinth bean
- garland chrysanthemum
- millet
- quinoa
- cashew
- sorghum
- date
- burdock root
- sesame seed
- black rice
- goji berry
- star anise
- brown rice
- water chestnut
- wheat
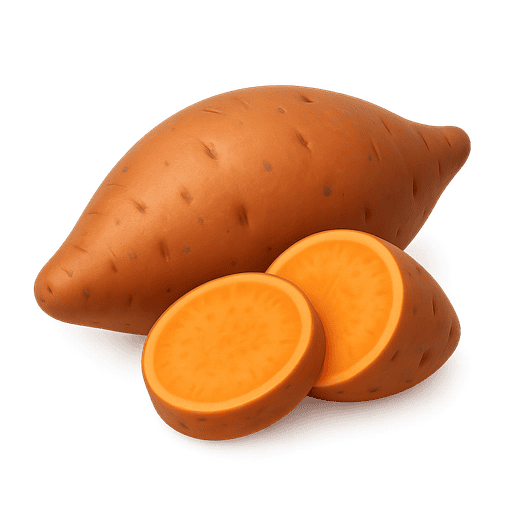
02 / 14 Tubers & starchy vegetables
50 g/day range 0–100 g 39 kcal
For around a billion people, a tuber is what the day starts and ends with — boiled cassava in West Africa, sweet potato in Polynesia, potato in the Andes, taro in Hawai‘i. Tubers do not form a clean cluster in the world's recipe corpus the way grains do; instead they sit at the edges of vegetable, grain, and stew neighbourhoods. Listed below are the canonical exemplars present in the Epicure vocabulary.
Canonical exemplars in the world's pantry
- potato
- sweet potato
- cassava
- yam
- taro
- plantain
These ingredients don't form a clean cluster in Epicure — they
scatter across adjacent food neighbourhoods depending on cuisine.
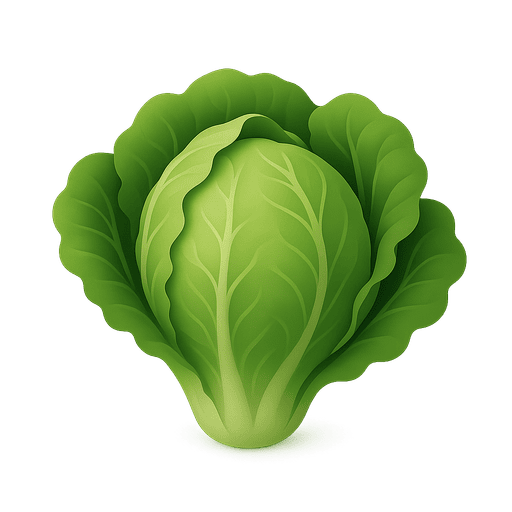
03 / 14 Vegetables
300 g/day range 200–600 g 78 kcal
Vegetables are where Epicure's cross-cuisine geometry comes alive. The three neighbourhoods below capture the same Commission category — vegetables — split into three culturally coherent clusters: the fresh salad-and-garden bowl of Mediterranean and Western cuisines, the stir-fry universe of East Asia, and the wider mushroom-and-leaf vocabulary that defines Asian cooking traditions. They are not interchangeable as recipes, but they are interchangeable in role.
What Epicure shows
(the recipe-corpus clusters that fill this role)
Fresh salad and garden vegetables cluster of 90 ingredients - red onion
- portobello mushroom
- bell pepper
- frisee
- salad greens
- swiss chard
- radicchio
- kale
- sugar snap pea
- artichoke
- butternut squash
- shallot
- serrano pepper
- jicama
- microgreen
- banana pepper
- fennel
- black olive
East-Asian stir-fry vegetables cluster of 57 ingredients - scallion
- wood ear mushroom
- enoki mushroom
- shiitake mushroom
- bok choy
- bamboo shoot
- oyster mushroom
- garland chrysanthemum
- yard long bean
- water spinach
- chayote
- garlic
- leek
- luffa
- arrowhead
- radish
- burdock root
- maitake mushroom
East Asian vegetables and mushrooms cluster of 71 ingredients - napa cabbage
- crab mushroom
- king oyster mushroom
- celtuce
- lotus root
- yu choy
- garlic scape
- bean sprout
- konjac
- daikon
- chili pepper
- dried lily bud
- zha cai
- water bamboo
- pickled mustard green
- straw mushroom
- pickled radish
- tea tree mushroom

04 / 14 Fruits
200 g/day range 100–300 g 126 kcal
Two fruit worlds. The first, surfaced below, is the temperate one most readers picture — apples, pears, berries, citrus. The second is the tropical one most readers have never seen on a tree — longan, lychee, durian, mangosteen, jujube. The split in Epicure's atlas is essentially geographic. The Commission's 200 g a day is met equally well from either basket.
What Epicure shows
(the recipe-corpus clusters that fill this role)
Fresh and preserved whole fruits cluster of 71 ingredients - nectarine
- orange
- cherry
- fruit
- prune
- pomegranate
- kiwi
- blueberry
- candied fruit
- watermelon
- peach
- cape gooseberry
- black currant
- raspberry
- blackberry
- strawberry
- apple
- maraschino cherry
Asian tropical and medicinal fruits cluster of 53 ingredients - red date
- longan
- goji berry
- coconut milk
- hawthorn
- monk fruit
- date
- sea coconut
- lychee
- dragon fruit
- mulberry
- kumquat
- tamarind
- jackfruit
- starfruit
- pomelo
- rambutan
- lime

05 / 14 Legumes
75 g/day range 0–100 g 284 kcal
The 2025 Commission's most consequential ask. Across legumes, soy, and nuts, the diet wants around 225 grams a day of plant protein — roughly five times what wealthy diets contain. Below, the first cluster shows the protein-dense legume-and-spice neighbourhood that defines Indian, Middle Eastern, and Mexican cooking; the second surfaces the Latin American beans-and-tortilla pattern. The same role, two cuisines apart.
What Epicure shows
(the recipe-corpus clusters that fill this role)
Protein-dense legumes meats and spices cluster of 60 ingredients - paprika
- chili powder
- chickpea
- fennel seed
- kidney bean
- lentil
- monterey jack cheese
- cumin
- chorizo
- colby cheese
- mustard seed
- textured soy protein
- white bean
- cotija cheese
- curry powder
- curry
- queso fresco
- black eyed pea
Latin spices beans and tortillas cluster of 27 ingredients - chili powder
- cayenne pepper
- serrano pepper
- corn tortilla
- cumin
- black bean
- ancho chile
- flour tortilla
- pinto bean
- mustard seed
- chickpea
- tortilla
- paprika
- kidney bean
- fenugreek seed
- lentil
- guajillo chile
- turmeric

06 / 14 Soy foods
25 g/day range 0–50 g 112 kcal
Soy lives a double life in the world's kitchens. As a whole food — tofu, tempeh, edamame — it is a protein source the Commission specifically encourages. As a fermented condiment — soy sauce, miso, doubanjiang — it is a flavour foundation across East Asia. Epicure separates these two roles into different neighbourhoods, exactly as a chef would.
What Epicure shows
(the recipe-corpus clusters that fill this role)
East Asian soy and spice staples cluster of 22 ingredients - sichuan peppercorn
- soybean paste
- dried tofu
- lotus root
- five spice powder
- fried tofu puff
- pickled mustard green
- green sichuan peppercorn
- udon noodle
- sesame paste
- snow vegetable
- mustard green
- miso
- edamame
- doenjang
- lions mane mushroom
- sweet preserved mustard green
- somen noodle
Cross-cutting view
(by flavour, nutrient profile, or processing level)
East Asian savory sauces and condiments cluster of 95 ingredients - oyster sauce
- light soy sauce
- doubanjiang
- hot pot base
- mala sauce
- dark soy sauce
- black bean paste
- chili sauce
- seasoning sauce
- rice vinegar
- msg
- shacha sauce
- chili garlic sauce
- fish sauce
- sweet chili sauce
- sweet bean sauce
- gochujang
- hoisin sauce

07 / 14 Nuts & seeds
25 g/day range 0–75 g 149 kcal
Almonds, walnuts, peanuts, cashews, sesame, sunflower, pumpkin, pistachio. Across the world's cuisines, nuts and seeds are the densest protein and fat source you can keep on a shelf. Epicure clusters them together cleanly: the protein-dense nut-and-seed neighbourhood is the largest-z cluster in the entire atlas, meaning the model is unusually confident that these ingredients belong together.
What Epicure shows
(the recipe-corpus clusters that fill this role)
Protein-dense seeds and nuts cluster of 47 ingredients - chia seed
- cashew
- pumpkin seed
- quinoa
- hemp seed
- flaxseed
- soy protein isolate
- spirulina
- almond butter
- sunflower seed
- hazelnut
- mung bean
- wheat germ
- black sesame seed
- lotus seed
- goji berry
- spelt
- amaranth
Cross-cutting view
(by flavour, nutrient profile, or processing level)
Rich nuts, fats, and spirits cluster of 81 ingredients - white chocolate
- hazelnut
- egg yolk
- milk chocolate
- coconut oil
- pistachio
- pumpkin seed
- almond
- cream
- egg
- walnut
- macadamia nut
- irish cream
- almond paste
- hemp seed
- praline
- vanilla
- rum

08 / 14 Dairy
250 g/day range 0–500 g 153 kcal
Milk and its descendants — yoghurt, cheese, kefir, paneer, labneh — feed a billion people. They are also the single highest-emission food per gram in the diet that the Commission tolerates at scale. The reference value (250 g/day) is therefore a compromise, with an explicit lower bound of zero. The yoghurt and fermented forms now have the strongest health evidence; the cheese cluster sits at much higher caloric density, which is why the Commission's reference is for fluid-milk equivalents.
What Epicure shows
(the recipe-corpus clusters that fill this role)
Eggs cream and cultured dairy cluster of 37 ingredients - cream
- egg yolk
- egg
- egg white
- condensed milk
- mascarpone cheese
- salted duck egg
- quail egg
- creme anglaise
- ice cream
- duck egg
- curd
- century egg
- goose egg
- whipped topping
- egg substitute
- pigeon egg
- eggnog
Semi-firm artisan cheeses cluster of 48 ingredients - fontina cheese
- asiago cheese
- monterey jack cheese
- colby cheese
- havarti cheese
- manchego cheese
- ricotta salata
- creme fraiche
- gorgonzola cheese
- cotija cheese
- caciocavallo
- queso fresco
- grana padano
- jarlsberg cheese
- taleggio cheese
- american cheese
- oaxaca cheese
- robiola cheese

09 / 14 Fish & shellfish
28 g/day range 0–100 g 40 kcal
Two 100-gram servings of fish a week — about a fillet at each — gives the diet what it cannot easily get elsewhere: long-chain omega-3 fats. The Commission specifically flags small pelagic fish, bivalves, and seaweed as under-recognised options. Epicure's lean-fish-and-seafood neighbourhood, below, is the cleanest fish cluster in the atlas, ranked by protein density.
What Epicure shows
(the recipe-corpus clusters that fill this role)
Lean fish and seafood proteins cluster of 86 ingredients - tofu
- carp
- fried tofu puff
- octopus
- cod
- dried tofu
- sea snail
- frog leg
- snail
- grouper
- red snapper
- dried shrimp
- catfish
- trout
- monkfish
- sea bass
- luncheon meat
- halibut

10 / 14 Poultry
29 g/day range 0–58 g 62 kcal
About two servings a week. Chicken, turkey, and duck sit between red meat and plant protein on almost every nutritional and environmental axis. Epicure doesn't separate poultry into a discrete neighbourhood — these ingredients scatter across protein-dense clusters depending on what they are cooked with. Listed below are the canonical exemplars in the Epicure vocabulary.
Canonical exemplars in the world's pantry
- chicken
- turkey
- duck
These ingredients don't form a clean cluster in Epicure — they
scatter across adjacent food neighbourhoods depending on cuisine.

11 / 14 Eggs
13 g/day range 0–25 g 19 kcal
Two eggs a week, with a range as wide as the Commission's evidence will allow. Most striking: Epicure does not cluster eggs into their own neighbourhood — they co-cluster with cream and cultured dairy, because of how they appear together in baked goods, breakfast dishes, and emulsified sauces across the world's recipes. The culinary geometry follows the kitchen, not the supermarket aisle.
Canonical exemplars in the world's pantry
- egg
- egg white
- egg yolk
- quail egg
- duck egg
These ingredients don't form a clean cluster in Epicure — they
scatter across adjacent food neighbourhoods depending on cuisine.

12 / 14 Red meat
14 g/day range 0–28 g 30 kcal
About one serving a week, with a range that begins at zero. This is the diet's single most-discussed reference value, the gap between current diets and the recommendation, and the one for which the Commission has called for a 33 % global production reduction. Red meat does not form its own clean Epicure cluster — beef, pork, and lamb scatter across protein-dense neighbourhoods alongside cured-meat preparations. Listed below are the canonical exemplars.
Canonical exemplars in the world's pantry
- beef
- lamb
- pork
- veal
- mutton
- venison
- bacon
These ingredients don't form a clean cluster in Epicure — they
scatter across adjacent food neighbourhoods depending on cuisine.
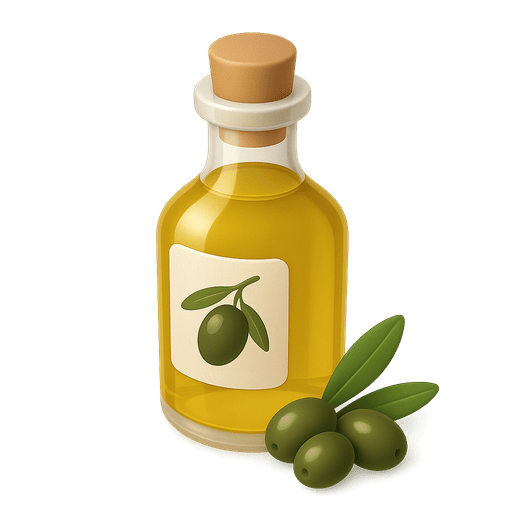
13 / 14 Added unsaturated plant oils
40 g/day range 20–80 g 354 kcal
About 17 % of total energy. Plant oils — olive, canola, sunflower, soybean, sesame — are how the Mediterranean diet, the closest real-world cuisine to the planetary diet, fills its energy gap. Palm oil and tropical oils are excluded from this share. Oils don't form a clean Epicure mode — they appear as functional pantry items across many neighbourhoods. Below are the canonical exemplars.
Canonical exemplars in the world's pantry
- olive oil
- canola oil
- sunflower oil
- soybean oil
- peanut oil
- sesame oil
- avocado oil
- walnut oil
These ingredients don't form a clean cluster in Epicure — they
scatter across adjacent food neighbourhoods depending on cuisine.
14 / 14 Added sugars
31 g/day range 0–31 g 120 kcal
The diet's cap, not its target. At most 5 % of daily energy — about 31 grams a day — should come from added sugars (table sugar, syrups, honey, fruit-juice concentrates added to food). The Commission flags this not as a vitamin or mineral story but as a cardiometabolic risk. Epicure's sugar neighbourhood, below, surfaces the ultra-processed confection cluster the diet is trying to constrain, presented here as a cautionary view, not a recommendation.
What Epicure shows
(the recipe-corpus clusters that fill this role)
Sweet confections and sugary fruits cluster of 140 ingredients - white chocolate
- liqueur
- chocolate
- cookie
- milk chocolate
- coffee liqueur
- candied fruit
- maple syrup
- frosting
- sponge cake
- graham cracker
- brown sugar
- maraschino cherry
- whipped topping
- cherry
- ice cream
- cherry liqueur
- toffee
Cross-cutting view
(by flavour, nutrient profile, or processing level)
Processed sweet confections and desserts cluster of 85 ingredients - chocolate
- frosting
- white chocolate
- sprinkles
- cookie
- ganache
- meringue
- milk chocolate
- toffee
- pudding
- buttercream
- candy
- sponge cake
- fudge
- waffle
- marzipan
- condensed milk
- graham cracker