Last updated: April 4, 2023
In Brief
UN Foundation
Climate Change · The State of the Science
Note: This data visualization was created in 2014 for the IPCC Fifth Assessment Report (AR5). Since then, the IPCC Sixth Assessment Report (2021–2023) has further confirmed and strengthened these findings — concluding that human influence on the climate system is now unequivocal. For GLOBAÏA’s most current climate work, see the Corridor of Life interactive and the Planetary Observatory.
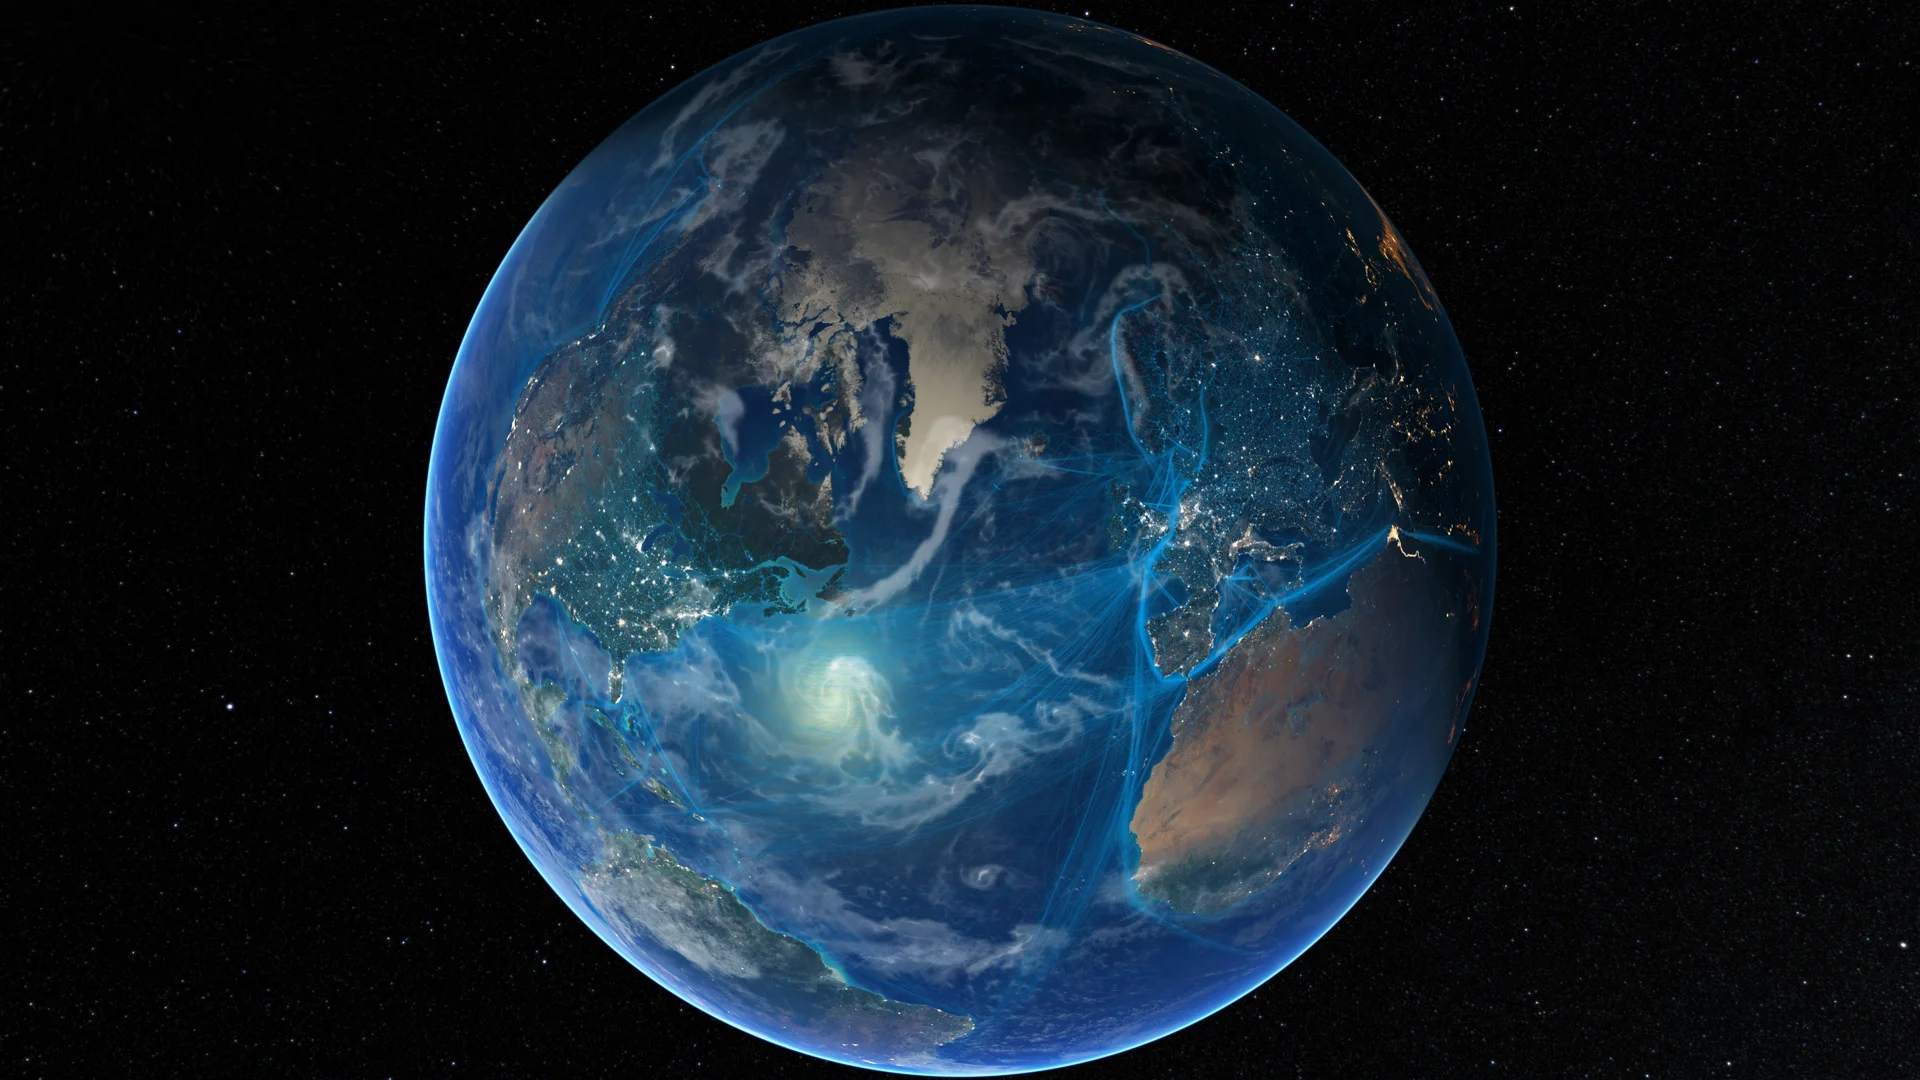
Created through a collaboration between the International Geosphere-Biosphere Programme and GLOBAÏA, and supported by funding from the United Nations Foundation, this data visualisation presents a compelling synthesis of the most crucial findings from the Intergovernmental Panel on Climate Change’s (IPCC) Fifth Assessment Report.
Specifically, the visualisation focuses on the Working Group I Summary for Policymakers, which outlines the Physical Science Basis of climate change. In 2014, the IPCC released additional summaries that delved into the societal impacts of climate change, as well as potential mitigation and adaptation strategies.
By effectively summarising and visually representing these key points from the IPCC’s comprehensive report, this data visualisation offers a powerful tool for increasing awareness and understanding of the urgent challenges posed by climate change, ultimately empowering policymakers and the public to make informed decisions and take necessary actions.
Translations
Observed Temperature Change — Global surface temperature anomalies highlighting the accelerating warming trend over recent decades.

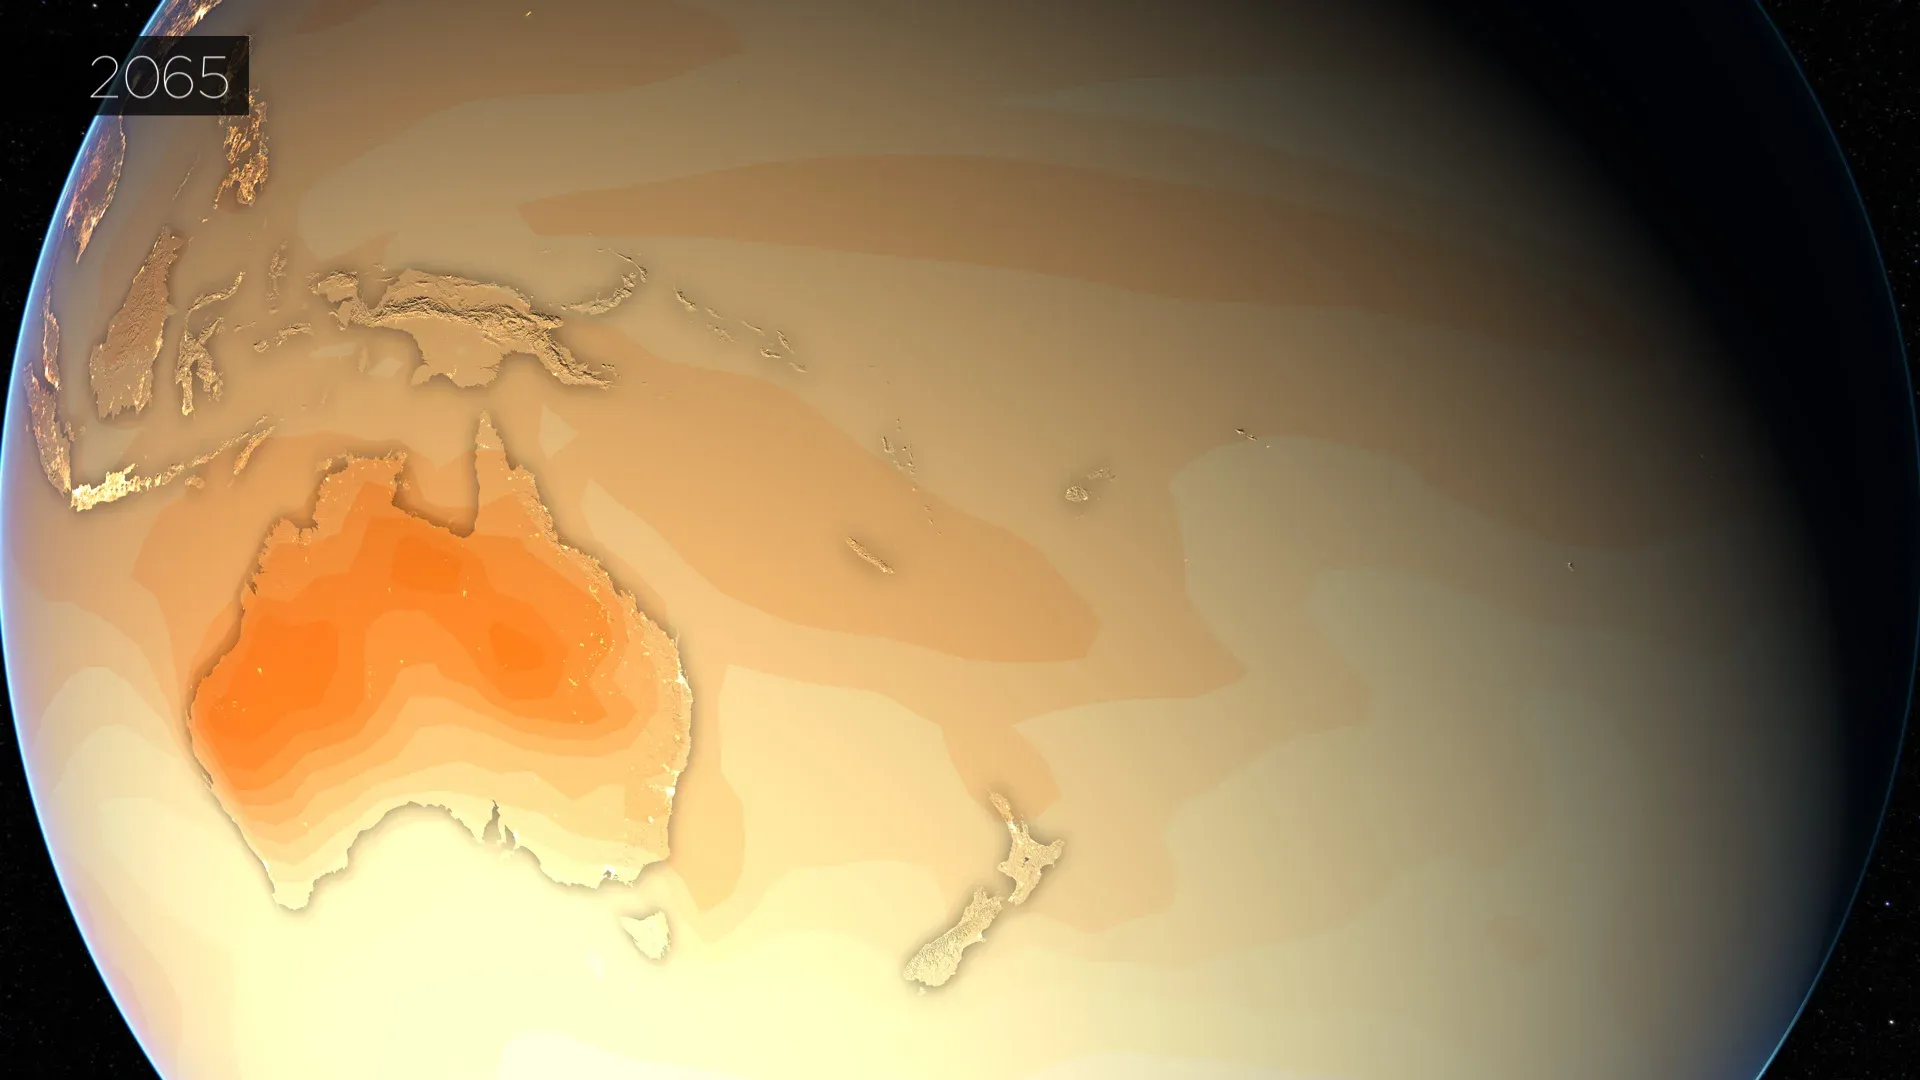
Climate Projections — Future warming scenarios based on different greenhouse gas emission pathways from the IPCC Fifth Assessment Report.
CO2 Concentrations — Atmospheric carbon dioxide levels showing the unprecedented rise driven by fossil fuel combustion and deforestation.

Sea Level Rise — Observed and projected changes in global mean sea level, reflecting thermal expansion and ice sheet contributions.
Ocean Heat Content — The accumulation of heat energy absorbed by the world’s oceans, a key indicator of the Earth’s energy imbalance.
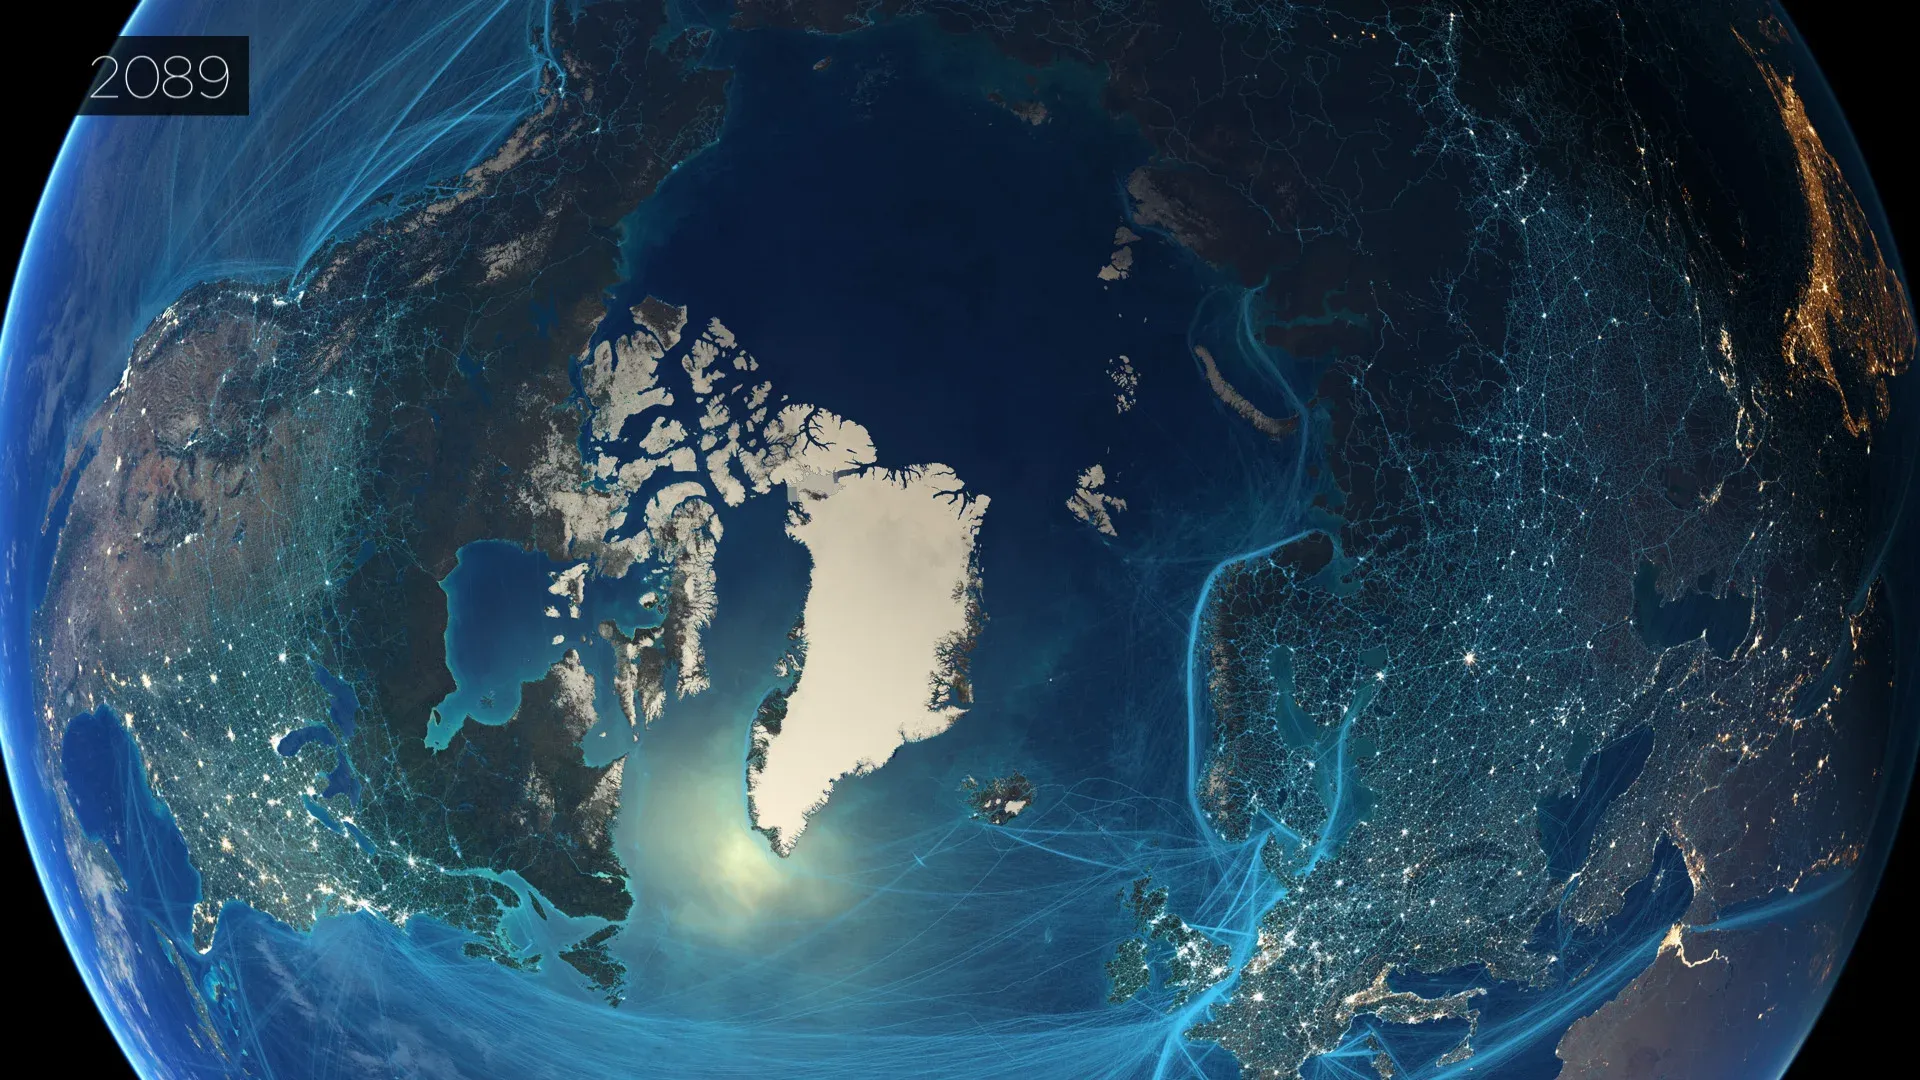
Arctic Sea Ice — The dramatic decline in Arctic sea ice extent, one of the most visible consequences of global warming.