The long view
Five hundred thousand years, drawn as a single line
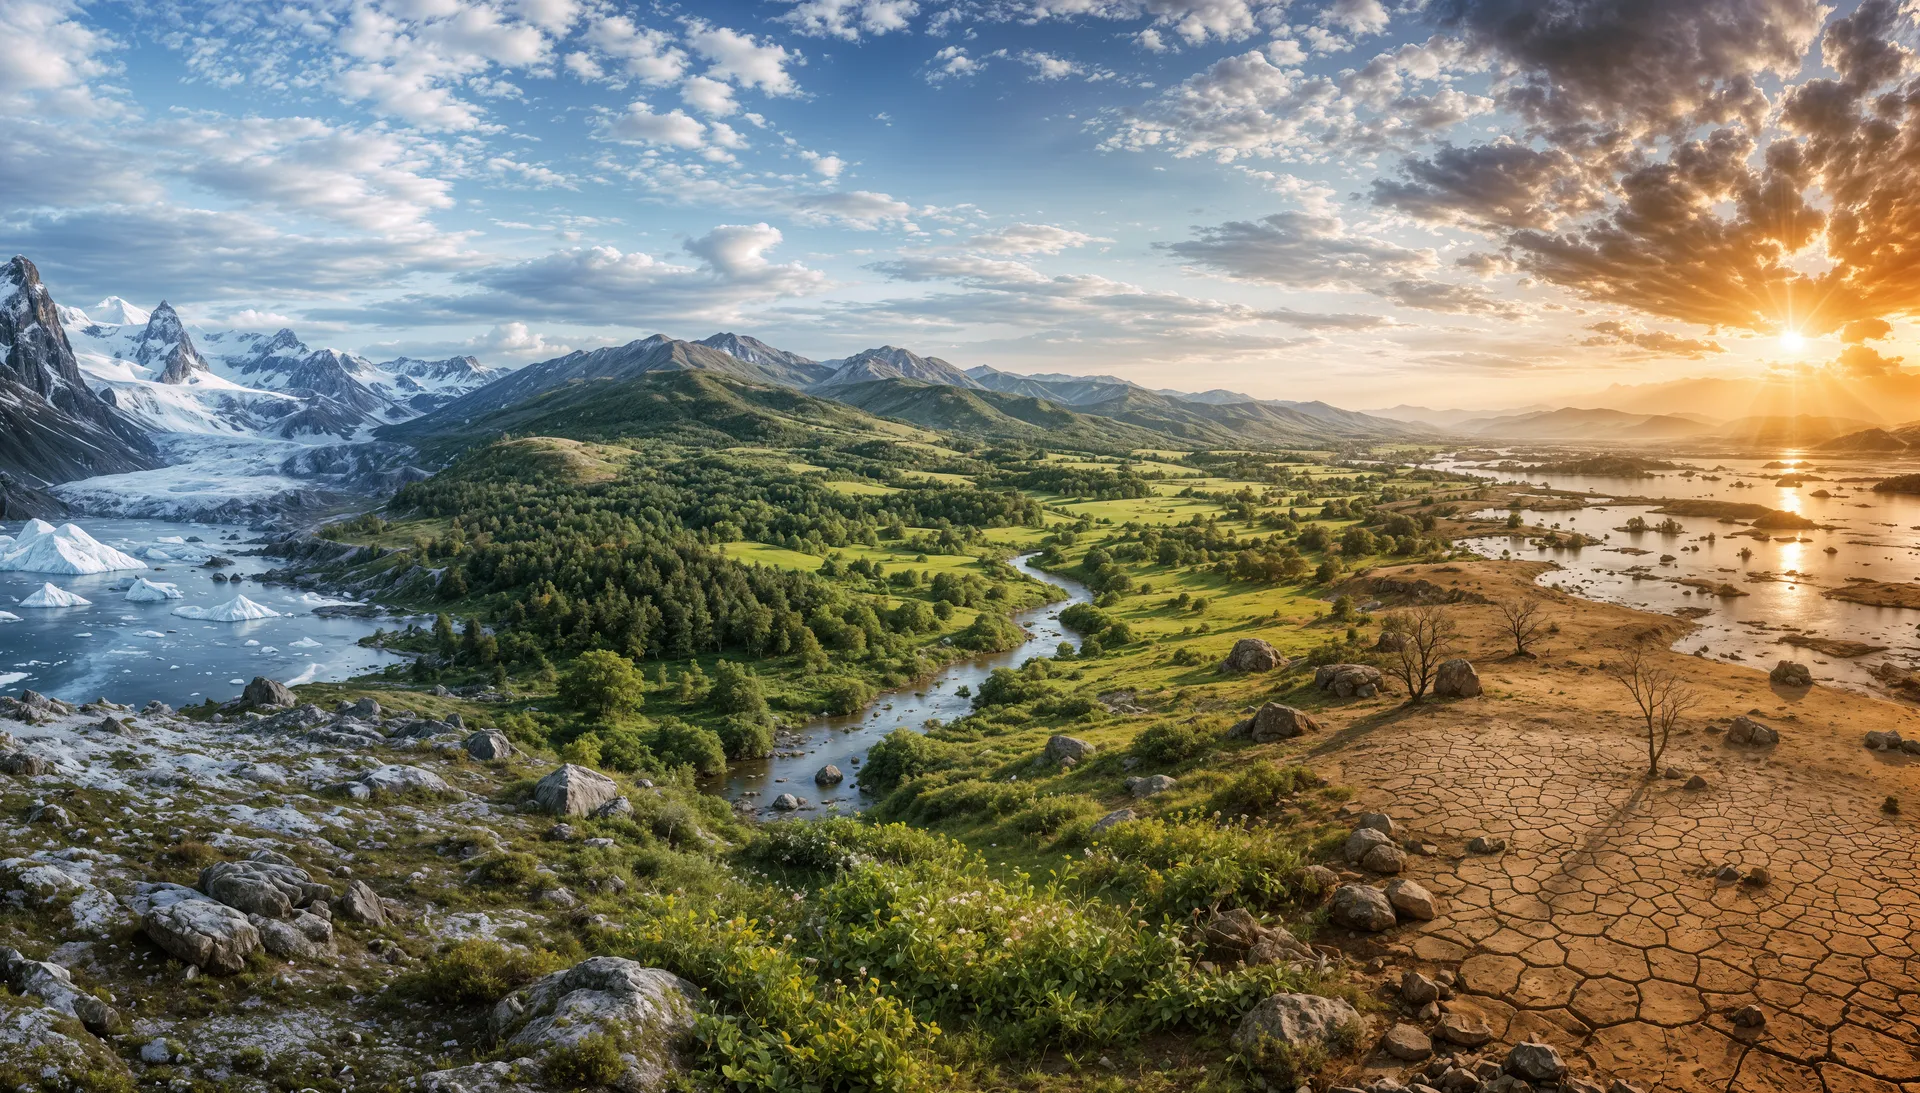
One line. Look at it before you read anything else: a single pale thread that wanders, plunges, climbs, and finally rears upward at the far right like a wave about to break. That thread is the average temperature of the entire planet, and it carries within it the whole story of us.
The chart compresses roughly half a million years of Earth's global mean temperature into three windows. The vertical scale is the simplest part: it measures how warm or cool the world was compared with the pre-industrial average, the climate our ancestors knew before coal smoke. Above the midline, warmer. Below it, colder. Every wobble is a real reconstructed climate, pieced together from Antarctic ice cores that trapped ancient air bubble by bubble (Jouzel et al., 2007), from the chemistry of seafloor mud (Lisiecki & Raymo, 2005), and from hundreds of natural thermometers spanning the last ice age to today (Osman et al., 2021).
The three panels are three zoom levels, telescoping toward the present. Panel A opens in deep ice-age time, where the line saws violently up and down across hundreds of thousands of years. Panel B follows the climb out of the last ice age into our brief warm interlude. Panel C holds a magnifying glass over the last few centuries, the modern moment, and the futures still open to us.
Read it as a climate record, yes. But read it also as an autobiography. Somewhere along that wandering line our species first walked, first spoke, first painted on cave walls; later, agriculture, cities, writing, and everything we call history appeared. And here is the quiet revelation the whole chart is built to show you.
Everything we know as civilization happened inside one narrow band of temperature.
Not the violent swings of the deep past, but a rare, comparatively steady warmth that arrived only recently and may now be slipping (Marcott et al., 2013). To see why that band matters so much, we begin at the wild end. Turn to Panel A, and watch the line that could not sit still.
The Ice-Age World
The Pleistocene · 500,000 to 12,000 years ago
For most of the time our kind has existed, the world was cold, and it would not hold still. The chapter we live in opens not with calm but with a long, shivering theatre of ice — the Pleistocene, the roughly 2.6-million-year stretch in which the genus Homo, and at last Homo sapiens, learned to be human.
Look at Panel A: that jagged pale line, sawing relentlessly up and down, is the planet's temperature itself, lurching between bitter cold and brief warmth. Each deep trough is a glacial maximum — a time when ice sheets kilometres thick smothered the north. The Laurentide sheet buried Canada; the Fennoscandian crushed northern Europe under a frozen dome. So much water was locked in ice that the seas fell roughly 120 metres, baring land bridges. One of these, across what is now the Bering Strait, would one day let people walk into the Americas, alongside mammoths and woolly rhinoceros.
What sets the rhythm of those swings? Not chance, but astronomy. Slow wobbles in Earth's orbit and tilt — the Milankovitch cycles — gently redistribute sunlight over tens of thousands of years, pacing the advance and retreat of the ice (Hays, Imbrie & Shackleton, 1976). We can read this beat in Antarctic ice cores from Dome C, where trapped air and snow chemistry preserve eight successive glacial cycles (EPICA Community Members, 2004), a record since extended across the past 800,000 years (Jouzel et al., 2007). Each brief peak on that pale line is a warm interglacial, a window soon slammed shut again.
Through all of it lived small, mobile bands of hunter-gatherers — keeping fire, following herds, and, in the deep dark of caves at Chauvet and later Lascaux, painting lions and horses by lamplight. They were survivors of a climate that could lurch without warning, sometimes reorganising itself within a human lifetime.
And here is the point that shapes everything to come. In a world this restless, farming and cities were effectively impossible. The climate was too variable, too unpredictable, the growing seasons too uncertain to risk staking a settlement on a planted field (Richerson, Boyd & Bettinger, 2001).
The ice age was not a frozen pause in human history. It was the volatile cradle that made us — and the thing we could not yet escape.
Notice the sheer amplitude of that sawing line, the violence of its rises and falls. Hold it in your eye. For what comes next, as Panel B will show, is something our species had almost never known: a long, improbable calm.
Into the Corridor of Life
The great thaw and the Holocene · the last 12,000 years
Look at Panel B. The long line climbing out of the deep is the world thawing — Earth hauling itself out of the last great cold.
Around twenty-one thousand years ago, at the Last Glacial Maximum, ice sheets buried Scandinavia and most of Canada, and the planet was roughly five to six degrees Celsius colder than the world before industrialization (Osman et al., 2021). Then the long rise began. It was not smooth. About 12,900 years ago the warming stalled and reversed in a violent cold snap — the Younger Dryas — that locked Europe back into near-glacial winters for over a thousand years before the climate finally steadied. You can read that turbulence in the jagged ascent of the line.
What came next is the calm green band: the Holocene, the last 11,700 years of unusually stable warmth (Marcott et al., 2013). After ten thousand centuries of lurching cold, the thermostat held. And within a few centuries of that settling, something happened that had never happened before. People began, independently and on different continents, to farm.
In the Fertile Crescent they tamed wheat and barley; along the Yangtze, rice; in the tropical lowlands of Mexico, maize. Farming had been effectively impossible in the wild swings of the ice age and became almost mandatory in the new stability (Richerson, Boyd & Bettinger, 2001). From stored grain came surplus, and from surplus came villages, granaries, the first towns and cities — Çatalhöyük, and later Uruk — then clay tablets, kings, and laws. Every civilization we have ever built grew inside this band of warmth.
This is the Corridor of Life — the green band itself: the narrow envelope, roughly within one degree Celsius of the Holocene average, that describes the only climate any human society has ever known. Earth-system science treats this Holocene-like state as humanity's safe operating space (Rockström et al., 2009; Steffen et al., 2015).
For ten thousand years the corridor held. We are the first generation to step beyond its walls.
Now follow the line to the right rim of Panel B. After millennia of gentle drift, it stops wandering and shoots almost straight up — the modern spike, vertical against all that came before. That sudden rise carries us toward Panel C, and out of the corridor.
The Anthropocene
Industry, the Great Acceleration, and the climb out · 1750–2100
For ten thousand years the line walked the green band. Then, around 1750, in the damp valleys of northern England, something changed: men began to burn coal to drive steam engines, and the buried carbon of forests that had grown and died hundreds of millions of years ago started rising into the air as smoke.
This is where Panel C begins. At first the change is faint — a slow lean upward through the age of mills, railways, and gaslit cities. Burning fossil carbon released carbon dioxide that trapped a little more of the Sun's heat, and for the first time a species was nudging the whole climate (Crutzen, 2002). For two centuries the nudge stayed gentle.
Then watch the lower band of the panel, where a fine bundle of coloured threads suddenly climbs together. After about 1950 nearly every measure of human life bent sharply upward at once — population, energy use, water withdrawals, fertiliser, motor vehicles, telephones, the global economy itself. Earth-system scientists call this the Great Acceleration (Steffen et al., 2015, The Anthropocene Review; McNeill & Engelke, 2016). It is the steepest, most synchronised burst of change in the human story, and it left traces — radioactive fallout, plastics, fly ash — written into the very rock and ice, prompting scientists to propose that we had entered a new human-shaped epoch, the Anthropocene (Waters et al., 2016).
Now look at the black line, the actual measured temperature of the planet (Morice et al., 2021). It has lifted clean out of the green Corridor of Life and now sits above it. The pulsing red dot — here, now, you and everyone you know — marks more than 1.3 degrees Celsius above the pre-industrial climate; in 2024 the planet's average passed 1.5 degrees for the first calendar year on record, beyond anything our farms, cities, and coastlines were built for.
The calm green band took ten millennia to settle. We climbed out of it in a single human lifetime.
After the dot, the line splits into spreading fans — the futures we might choose (IPCC, 2021). The blue fan, deep and rapid cuts to emissions, holds warming near the corridor's upper rim, around 1.5 to 2 degrees. The orange and red fans, business roughly as usual, carry us toward 3 degrees or more by 2100 — a planet no human civilization has ever known. Which fan we follow is not yet written. But somewhere along those steep climbs lie thresholds the system may not let us walk back.
The lines we must not cross
Tipping points and the 1.5 °C threshold
Here is the hinge of the whole story, and it turns on a single question: not just how warm, but how warm before something breaks. Look back at Panel C, at the upper edge of that climbing line. We tend to imagine the climate as a dial — turn it a little, get a little change. But the Earth system is not a dial. It is a landscape of valleys and ridges, and some of its largest features can roll over a crest and keep going on their own.
Scientists call these features tipping elements — among them the Greenland and West Antarctic ice sheets, the Atlantic overturning circulation that warms Europe, the Amazon rainforest, and the world's tropical coral reefs (Lenton et al., 2008; Armstrong McKay et al., 2022). Each can pass a threshold beyond which its change becomes self-sustaining: ice that has melted exposes dark ocean that absorbs more heat and melts more ice; a forest that has dried tips into savannah and cannot easily grow back. Beyond such a point the change is, on the timescales of a human life or a civilization, effectively irreversible (Lenton et al., 2008).
This is why the exact height the line reaches matters so much. On Panel B, the upper edge of the green Corridor of Life sits near +1 degree Celsius — and the pulsing red dot on Panel C, where we stand today, has already lifted above it. The next line the future fans must cross is 1.5 degrees.
The landmark special report on that figure found that risks do not rise gently but steeply between 1.5 and 2 degrees — for reefs, for coastlines, for the people who live by them (IPCC, 2018). A 2022 synthesis went further: several tipping points could be triggered within that very 1.5-to-2-degree window we are now entering, with a handful — including warm-water reefs and parts of the great ice sheets — already possible at today's warmth (Armstrong McKay et al., 2022; Lenton et al., 2019).
Cross enough thresholds and they begin to push one another — a cascade that could carry the planet onto a “Hothouse Earth” pathway, warm and stable but far outside anything our species has known (Steffen et al., 2018).
This is the turn. The same fact that makes the threshold dangerous makes it meaningful: a line is something you can choose not to cross. Every tenth of a degree the future fans bend back toward the green band is a coast saved, a reef given another century, a door kept open. The story does not end at the red dot. It pauses there, and asks which way we will go.
The road back into the corridor
Net zero, the Paris goal, and the futures still open
Look again at Panel C, at the moment after the pulsing red dot that marks where we stand. The fans of possible futures open like a hand. The red and orange spread upward, away from home. But one of them, the blue fan, bends. It curves back down toward the green band of the corridor. That path is not a fantasy. Physics keeps it open.
Here is the reason for grounded hope. Global warming tracks almost linearly with the total amount of carbon dioxide humanity has ever released, the running sum we call cumulative emissions. The implication is quietly revolutionary: when we reach net zero, adding no more than we remove, the warming essentially stops. The line in Panel C can be made to level off (IPCC, 2021). We are not on a runaway train with no brake. We are holding the throttle.
The world has even agreed on the destination. In Paris in 2015, nearly every nation pledged to hold warming well below 2 degrees Celsius and to pursue 1.5 (UNFCCC, 2015). And we have already done this once, at planetary scale. When chemicals were tearing a hole in the ozone layer, the Montreal Protocol of 1987 phased them out, and that shield is now on track to recover within decades (WMO & UNEP, 2022). Humans have steered a planetary system back from harm before.
Scientists have begun to draw the safe room more honestly. The planetary boundaries framework maps the nine processes that keep Earth hospitable (Rockström et al., 2009; Richardson et al., 2023); the Earth Commission then asked not only what is safe but what is fair, defining safe and just limits for all people (Rockström et al., 2023). Kate Raworth folded this into a single image, a doughnut whose inner ring is human need and outer ring is ecological ceiling (Raworth, 2017).
Tipping points need not all point downward.
And change can be self-reinforcing in our favour. The same runaway logic that frightens us in melting ice can work for us in human systems: as solar panels and batteries grow cheaper, they sell more, which makes them cheaper still, a positive social tipping point already underway (Otto et al., 2020).
So the chart leaves us with one honest question. The green corridor is still there on the screen, narrow but unbroken. The blue path that returns to it is real. Whether we walk it is the only thing not yet decided.